Service Discovery and Device Identification in Cognitive Radio - - PowerPoint PPT Presentation

service discovery and device identification in cognitive
SMART_READER_LITE
LIVE PREVIEW

Service Discovery and Device Identification in Cognitive Radio - - PowerPoint PPT Presentation

B A WiFi T Bluetooth Bluetooth WiFi F W C E Cognitive Radio D Service Discovery and Device Identification in Cognitive Radio Networks 21 May 2007 WINLAB Research Review Overview Cognitive Radio Introduction Can we use


slide-1
SLIDE 1

Service Discovery and Device Identification in Cognitive Radio Networks

21 May 2007 WINLAB Research Review

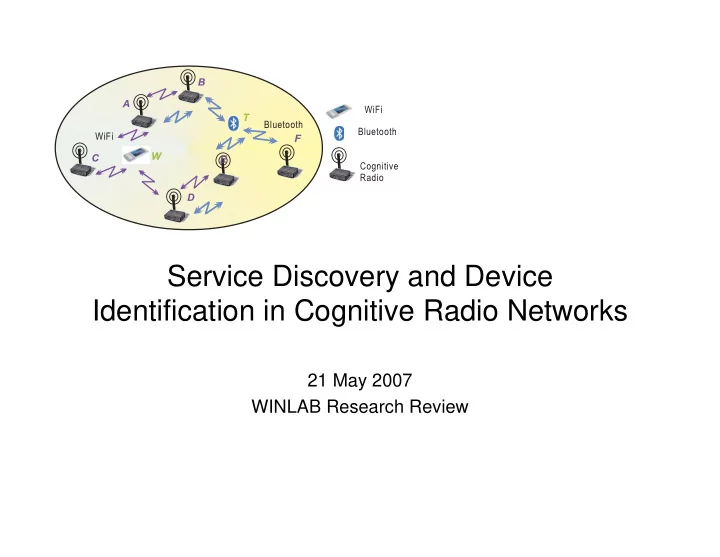
Cognitive Radio Bluetooth A B C D E F WiFi Bluetooth WiFi W T

slide-2
SLIDE 2

Overview

  • Cognitive Radio Introduction
  • Can we use Physical Layer info for:

– Service Discovery – Device Identification

  • Conclusions
slide-3
SLIDE 3

Cognitive Radio

  • Key Features

– Adaptive protocols – Complete PHY/MAC Layer control

  • Motivations

– Higher efficiency/throughput – Interference Avoidance Spectral Sensing is Important

slide-4
SLIDE 4

Spectral Sensing Options

  • Multi-dongle solution (Non-CR approach)
  • Multi-protocol full SW stack solution
  • Multi-protocol cooperative SW solution
slide-5
SLIDE 5

Spectral Sensing Options

  • Multi-dongle solution (Non-CR approach)
  • Multi-protocol full SW stack solution
  • Multi-protocol cooperative SW solution

– Processing re-use (+) – Implement partial protocols (+) – Full PHY Layer access (+)

  • Security advantages
slide-6
SLIDE 6

CR Platform

  • USRP

– 64 Msps A/D – USB 2.0 interface

  • 16-bit I/Q
  • 8 MHz BW*
  • RFX-2400

Transceiver

  • GNU Radio

*USB 2.0 Controller limits us to 4 MHz

slide-7
SLIDE 7

Service Discovery

  • Goal: Obtain a reliable estimate of the

services operating in the region.

Frequency (MHz) Time (s)

0.05 0.1 0.15 0.2 0.25 0.3 0.35 0.4 0.45 2465 2465.5 2466 2466.5 2467 2467.5 2468 2468.5

Periodic Broadband Bursts

slide-8
SLIDE 8

Service Discovery

  • 802.11g (Wi-Fi) Beacon Frames

– 20 MHz BW (OFDM) – Periodic (102.4 ms default)

Frequency (MHz) Time (s)

0.05 0.1 0.15 0.2 0.25 0.3 0.35 0.4 0.45 2465 2465.5 2466 2466.5 2467 2467.5 2468 2468.5

Wi-Fi Beacon Frames

slide-9
SLIDE 9

Service Discovery

  • ISM Band Spectrogram

– 50 ms snapshot

Narrowband Bursts

slide-10
SLIDE 10

Service Discovery

  • 802.15.1 (Bluetooth)

– 1 MHz Instantaneous BW (GFSK) – Frequency hops over 79 MHz

Bluetooth Wi-Fi

slide-11
SLIDE 11

Service Discovery Algorithm

Collection Classification Analysis

slide-12
SLIDE 12

Device Identification

  • Goal:

Supplement service discovery findings with device and network specific information.

– How many Bluetooth Piconets exist? – How many Wi-Fi networks exist? – Is a spoofed AP in the region?

slide-13
SLIDE 13

Device Identification

  • Bluetooth Piconets

– 1 Master – Maximum 7 Active Slaves – Synchronized to the Master’s clock

  • Timeslots (TS) are 625 µs
  • All transmissions begin on timeslot boundaries

– Specification allows for 20 µs of jitter

slide-14
SLIDE 14

Device Identification

  • Bluetooth Piconet Identification

– Method 1: Time-binning approach

  • Collapse all leading-edge times into a single TS

– Perform clustering analysis to determine # of Piconets

  • Partition a TS into time-bins

– Choose a time-bin resolution of 25 µs » 625/25 µs = 25 bins – Single Piconet tests resulted in only +/- 250 ns jitter!

1 2 3 4 5 6 25

1 TS = 625 µs

Piconet #

25us

slide-15
SLIDE 15

Device Identification

  • Bluetooth Piconet Identification

– Method 2: Bit-comparison approach

  • Demodulate detected bursts
  • Compare Channel Access Codes (CACs)

– CACs are derived from Master address – Use it as a Piconet identifier

CAC

slide-16
SLIDE 16

Device Identification

  • Bluetooth Piconet Identification

– Method 2: Bit-comparison approach

Frequency (MHz) Time (s) ← Bluetooth WiFi →

0.09 0.095 0.1 0.105 0.11 0.115 0.12 0.125 0.13 0.135 2465 2465.5 2466 2466.5 2467 2467.5 2468 2468.5

Burst 1 Burst 2

slide-17
SLIDE 17

Bluetooth Burst Demodulation

200 400 600 800 1000 1200 1400 1600 1800 2000 0.5 1

Magnitude

Normalized Burst Power

200 400 600 800 1000 1200 1400 1600 1800 2000 −200 200

Inst Freq

Inst Freq (KHz) − Burst 1

200 400 600 800 1000 1200 1400 1600 1800 2000 −200 200

Inst Freq

Inst Freq (KHz) − Burst 2

200 400 600 800 1000 1200 1400 1600 1800 2000 0.5 1

Magnitude Sample Number

Bitwise Exclusive−or

slide-18
SLIDE 18

Bluetooth Burst Demodulation

200 400 600 800 1000 1200 1400 1600 1800 2000 0.5 1

Magnitude

Normalized Burst Power

200 400 600 800 1000 1200 1400 1600 1800 2000 −200 200

Inst Freq

Inst Freq (KHz) − Burst 1

200 400 600 800 1000 1200 1400 1600 1800 2000 −200 200

Inst Freq

Inst Freq (KHz) − Burst 2

200 400 600 800 1000 1200 1400 1600 1800 2000 0.5 1

Magnitude Sample Number

Bitwise Exclusive−or

slide-19
SLIDE 19

Bluetooth Burst Demodulation

200 400 600 800 1000 1200 1400 1600 1800 2000 0.5 1

Magnitude

Normalized Burst Power

200 400 600 800 1000 1200 1400 1600 1800 2000 −200 200

Inst Freq

Inst Freq (KHz) − Burst 1

200 400 600 800 1000 1200 1400 1600 1800 2000 −200 200

Inst Freq

Inst Freq (KHz) − Burst 2

200 400 600 800 1000 1200 1400 1600 1800 2000 0.5 1

Magnitude Sample Number

Bitwise Exclusive−or

slide-20
SLIDE 20

Bluetooth Burst Demodulation

200 400 600 800 1000 1200 1400 1600 1800 2000 0.5 1

Magnitude

Normalized Burst Power

200 400 600 800 1000 1200 1400 1600 1800 2000 −200 200

Inst Freq

Inst Freq (KHz) − Burst 1

200 400 600 800 1000 1200 1400 1600 1800 2000 −200 200

Inst Freq

Inst Freq (KHz) − Burst 2

200 400 600 800 1000 1200 1400 1600 1800 2000 0.5 1

Magnitude Sample Number

Bitwise Exclusive−or

slide-21
SLIDE 21

Bluetooth Burst Demodulation

200 400 600 800 1000 1200 1400 1600 1800 2000 0.5 1

Magnitude

Normalized Burst Power

200 400 600 800 1000 1200 1400 1600 1800 2000 −200 200

Inst Freq

Inst Freq (KHz) − Burst 1

200 400 600 800 1000 1200 1400 1600 1800 2000 −200 200

Inst Freq

Inst Freq (KHz) − Burst 2

200 400 600 800 1000 1200 1400 1600 1800 2000 0.5 1

Magnitude Sample Number

Bitwise Exclusive−or

Same CACs

slide-22
SLIDE 22

Device Identification

  • Wi-Fi Access Points

– Method 1: Beacon Frame Periodicity

  • Analyze leading edge-times
  • Leverage standard deinterleaving algorithms

100ms

time 2 APs present time 1 AP? 2 APs? 3 APs? …

50ms 50ms

slide-23
SLIDE 23

Device Identification

  • Wi-Fi Access Points

– Method 1: Beacon Frame Periodicity

  • Analyze leading edge-times
  • Leverage standard deinterleaving algorithms

100ms

time 2 APs present time 1 AP? 2 APs? 3 APs? …

50ms 50ms

slide-24
SLIDE 24

Device Identification

  • Wi-Fi Access Points

– Method 1: Beacon Frame Periodicity

  • Analyze leading edge-times
  • Leverage standard deinterleaving algorithms

100ms

time 2 APs present time 1 AP? 2 APs? 3 APs? …

50ms 50ms

slide-25
SLIDE 25

Device Identification

  • Wi-Fi Access Points

– Method 2: Channel Estimation

  • Beacon-Frame

– 20 MHz OFDM » 64 sub-channels (= 312.5 KHz spacing)

  • First 8 µs used for Training (TS)

– Every 4th sub-channel is active

  • Next 8 µs used for Equalization (ES)

– Every sub-channel is modulated with equal power

TS ES data

slide-26
SLIDE 26

Device Identification

  • Wi-Fi Access Points

– Method 2: Channel Estimation

Beacon Frame:

8 µs Training Sequence 8 µs Equalization Sequence

2410 2410.5 2411 2411.5 2412 2412.5 2413 2413.5 −30 −25 −20 −15 −10 −5 5

Frequency (MHz) Magnitude (dB)

2410 2410.5 2411 2411.5 2412 2412.5 2413 2413.5 −30 −25 −20 −15 −10 −5 5

Frequency (MHz) Magnitude (dB)

Channel Sounding Waveform

slide-27
SLIDE 27

Channel Estimation

s(t) = transmitted signal n(t) = channel noise h(t) = channel response r(t) = received signal Channel Spectrum Estimate:

slide-28
SLIDE 28

Channel Estimation

  • Given K known APs, correlate against new

channel estimates as device identifiers:

– If AP i exceeds threshold, update profile – Else, declare a new AP (K+1)

  • But, should not incorporate phase in our

channel estimate for bursty transmissions

slide-29
SLIDE 29

Channel Estimation

  • So, only use magnitude:

Note: Correlation range is now [0,1]

slide-30
SLIDE 30

Channel Estimation

  • Experiment:

– 2 Wi-Fi Access Points – Identical settings (e.g. Channel, SSID, PRI, name, etc.)

0.1 0.2 0.3 0.4 0.5 0.6 0.7 0.8 0.9 1 0.1 0.2 0.3 0.4 0.5 0.6 0.7 0.8 0.9 1

Time (s) Normalized Magnitude

(Beacon 1, AP1) (Beacon 2, AP2) (Beacon 3, AP1) (Beacon 4, AP2)

slide-31
SLIDE 31

Channel Estimation

  • Experiment:

– 2 Wi-Fi Access Points – Identical settings (e.g. Channel, SSID, PRI, name, etc.)

4 6 8 10 12 14 16 18 0.2 0.4 0.6 0.8 1

Beacon Number XCorr 1 Beacon back 2 Beacons back

slide-32
SLIDE 32

Final Comments

  • Service Discovery and Device

Identification plausible even given our narrowband snapshot

  • Bluetooth and Wi-Fi only used as

illustrations of protocol-specific techniques

– Extend methodology to other protocols

  • Security Concerns

– Full PHY/MAC control can be dangerous – Framework developed to mitigate these risks

slide-33
SLIDE 33

Acknowledgements

  • Dr. Wade Trappe
  • Wenyuan Xu
  • Pandurang Kamat
slide-34
SLIDE 34

Questions and Comments?

  • Contact info:

Rob Miller rdmiller@winlab.rutgers.edu