Separation of Ethanol and Water with Extractive Distillation David - - PowerPoint PPT Presentation

separation of ethanol and water with extractive
SMART_READER_LITE
LIVE PREVIEW

Separation of Ethanol and Water with Extractive Distillation David - - PowerPoint PPT Presentation

Separation of Ethanol and Water with Extractive Distillation David LaJambe Ethanol-Water Systems Maximum purity from regular distillation limited by low-boiling azeotrope to 90 mole% ethanol Fuel grade ethanol requires 98.7 mole%


slide-1
SLIDE 1

Separation of Ethanol and Water with Extractive Distillation David LaJambe

Ethanol-Water Systems

  • Maximum purity from regular

distillation limited by low-boiling azeotrope to 90 mole% ethanol

  • Fuel grade ethanol requires 98.7

mole% ethanol Extractive Distillation

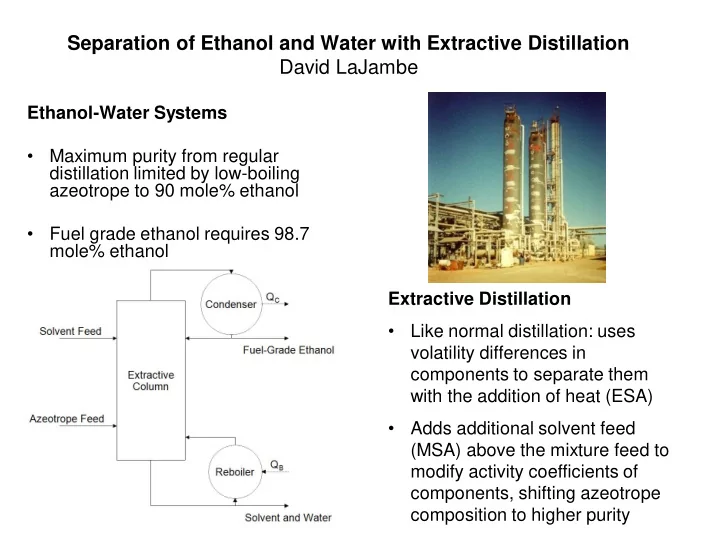
  • Like normal distillation: uses

volatility differences in components to separate them with the addition of heat (ESA)

  • Adds additional solvent feed

(MSA) above the mixture feed to modify activity coefficients of components, shifting azeotrope composition to higher purity

slide-2
SLIDE 2

Extractive Distillation Column - Operating Costs

Production Capacity

  • 70 million gallons of fuel-grade ethanol per year, worth $140 million
  • Capital cost of $1.35 million

Operating Costs

  • Utilities and maintenance – $4700/day for high pressure steam (reboiler),

chilled water (condenser), and labour (only ~$160 per day)

  • Glycerol solvent – $4200/day based on 99% recovery of glycerol from

regeneration column

  • Capital Depreciation = $100 per day
  • Total Operating Costs = $9000/day = $3.3 million/year

Suggested References: [1] J. Smith, H. Van Ness and M. Abbott, "VLE by Modified Raoult's Law," in Introduction to Chemical Engineering Thermodynamics, New York, McGraw-Hill Companies, Ltd., 2005, pp. 358-359. [2] J. Seader, E. J. Henley and D. K. Roper, "Extractive Distillation," in Separation Process Principles 3rd Edition, Hoboken, John Wiley & Sons, Inc., 2011, p. 424-428.

slide-3
SLIDE 3

Screen Separators or Trommel

  • Mainly used in Municipal Solid Waste (MSW) Management
  • Used to separate solid particles of different sizes
  • Fine particles (soil, grit, organic waste) fall through the screen as “unders”
  • Large particles (plastic films, paper products) retained on the screen as

“overs”

slide-4
SLIDE 4

Installation and Operating Costs

  • Can cost between $2000-$15000 (depending on size)
  • A trommel processing 62.5 tons/ hr of MSW, the capital costs involved was

$891,814

  • Operating costs (per ton) with an input of 202,800 tons of MSW were:

Shredder only - $1.4 l /ton Trommel and Shredder - $1.31 /ton

  • This results in a $109/ ton savings.
  • On an annual basis this gives a return of 6.7% on the incremental capital

cost. More Readings about Screen Separators

  • http://compost.css.cornell.edu/MSWFactSheets/msw.fs1.html
  • Christensen, Thomas H. "Solid Waste Technology and Management." Wiley. Book
  • http://www.seas.columbia.edu/earth/wtert/sofos/nawtec/1978-National-Waste-

Processing-Conference/1978-National-Waste-Processing-Conference-20.pdf

slide-5
SLIDE 5

Production of Sugar

Syed Usman Ahmed Laila Siddiqui

S u g a r C a n e

slide-6
SLIDE 6

Batch Filtration Centrifuge

  • Uses centrifugal force

m(rω2)

  • Takes advantage of

density difference

  • Spun at about 1200

RPM to filter sugar crystals from the uncrystallized solution it is suspended in(molasses).

slide-7
SLIDE 7

Sizing and Cost

Parameter Value D – basket diameter 1 m R – basket radius 0.5 m t – massecuite thickness 0.195 m d – massecuite ID 0.61 m r – massecuite IR 0.305 m Rm – equivalent radius 0.410 m h – height 1.4 m C – volumetric capacity per cycle 1.1m3/cycle 𝜕 – basket speed 1220 RPM G – gravitational force 682 g – force 𝜄 – cycles completed per hour 18.18 cycles per hours Q – massecuite throughput per hour 20 m3/hr Capital Cost (two batch centrifuges) Operating Cost (two batch centrifuges) Equipment - $132798 +/- 40% Electricity - $13277 Installation - $19918 Maintenance - $13279 Total - $132798 +/- 40% + $19918 for purchase and installation Total - $26556/year

References: Hugot, E., and G. H. Jenkins. Handbook of Cane Sugar Engineering. Amsterdam: Elsevier, 1986. Print. Geankoplis, Christie J. Transport Processes and Separation Process Principles: (includes Unit Operations). Upper Saddle River, NJ: Prentice Hall Professional Technical Reference, 2003. Print.

slide-8
SLIDE 8

Lactic Acid Purification from Fermentation: Multi-Effect Evaporation By: Derek Seguin & Nicole Rich-Portelli

GEA Process Engineering, Multi-Effect Evaporation: http://www.niroinc.com/evaporators_crystallizers/energy_evaporation_plants.asp 22Nov2012

slide-9
SLIDE 9

Operating Costs: Evaporation

n - Efficiency of the operating unit (typically 80%) P - Price of fuel $3.3e-6/kJ H - Enthalpies of incoming/exiting steam (kJ/kg) - from steam tables Operating cost (steam) = Cf*Flow rate of steam Operating cost (steam) = $0.011/kg * 29,185kg/h = $2,812,000/year Major factor: Steam generation Fuel cost (Cf) accounts for ~90% of the total cost

  • f steam generation

Resources: Geankopolis, C. J. (2003). Transport Processes and Unit Operations (4th ed.) Green, D., and Perry, R. Perry’s Chemical Engineers’ Handbook. 8th ed.

slide-10
SLIDE 10

Solvent Extraction of Vegetable Oils

slide-11
SLIDE 11

Capital Cost Shallow Bed Extraction Unit V = 4793 gal $212,016 ±20% $169,000 to $254,000 Operating Costs Energy $349, 305/year Hexane (Solvent) $22,442,770/year

  • Cerutti, Myriam. "Solvent Extraction of Vegetable Oils:

Numerical and Experimental Study." Food and Bioproducts Processing 90(2): pp. 199-204, 2012.

  • Williams, M.A. “Obtaining oils and fats from source materials.”

Bailey’s Industrial Oil and Fat Products, Fifth Edition. John Wiley & Sons: New York, 1996.

slide-12
SLIDE 12

PENICILLIN PRODUCTION

  • Space between disks around 0.5 to 3 mm
  • Disks used to reduce the sedimentation distance
  • The driving force is the difference in densities
  • Addition of Butyl Acetate

solution

  • Able to operate in a continuous

process

Faizan Abbasi Richard Cenedese

slide-13
SLIDE 13

CAPITAL COSTS

Purchase Price

$185 000

Installation

$18 500

Energy Costs

$10 000

OPERATING COSTS

Maintenance

$18 500

[2] Perry, RH, Perry’s Chemical Engineers’ Handbook, 8th Edition, McGraw-Hill, 2008 [1] Dong , H. R., & Guo, Q. Z. (2009, February 23). Separation and purification of penicillin g from fermentation broth by solvent sublation. Retrieved from: http://www.sciencedirect.com/science/article/pii/S1383586608004139

slide-14
SLIDE 14

Governed by:

  • Da = [A]org/[A]aq

For two-phase systems:

  • α = Da/Db
slide-15
SLIDE 15

Object Cost Capital Equipment $315 000/unit Raw Feed (Rose Petals) $729 700 000/year Ethanol Solvent $454 790/year Utilities $1524/year

Table 1 – Estimated capital and operating costs for 3% global production of β-citronellol.

References: [1] Geankoplis, C.J., Transport Processes and Separation Process Principles, 4th ed., New Jersey: John Wiley & Sons, Inc., 2008. [2] Bailes, P.J., et al., Liquid-Liquid extraction: The process, the equipment, University of Bradford (Great Britain), 1976.

slide-16
SLIDE 16

Adsorbent: Zeolites , high selectivity and compatibility for polar compounds (such as H2S) Adsorbate: H2S

Separating Methane from Natural Gas

  • Pressure swing
  • ccurs during the

regeneration stage

  • Reducing the

pressure empties the fully saturated adsorbent bed

By: Tamar Makdessian and Talia Ceti

slide-17
SLIDE 17

Cost Break down

Equipment FOB cost -40% FOB cost +40% Compressor $232 490 $406 858 Vessels (2) $1 488 756 $ 2 605 323 Total cost $ 1 721 246 $ 3 012 181 Raw Material Cost Per Year Nitrogen $2.75/ 100 ft3 $7 452 467 Zeolite $2/ kg $12

References: [1]Ruthven, Douglas, Farooq, Shamsuzzaman and Knaebel, Kent. Pressure Swing Adsorption. New York: 1994 [2] Cosoli, Paulo. Hydrogen Sulphide Removal from biogas by Zeolite Adsorption. Elsevier. URL<http://www.mose.units.it/doc/p0371.pdf>

slide-18
SLIDE 18

Disk‐Bowl
Centrifuge
for
Orange
Juice
 Clarifica8on


By:
Elaf
Kasim,
Sarah
Najib


Design
Equa8on:
 Terminal
SeFling
Velocity:


  • Orange
juice
with
10‐12
%
pulp
enters


at
top


  • The
feed
is
fed
to
rising
channels
and


split
to
disks


  • Density
difference
between
pulp
and


fluid
allow
solid
parAcles
to
flow
to
 conical
disks


  • Solid
parAcles
slide
to
holding
space


and
removed,
clarified
liquid
removed
 from
top


slide-19
SLIDE 19

Cos8ng
 Based
on
feed
rate
of
19.4L/s:
 Cost
 Amount
 Capital
Cost
 (includes
equipment,
 contractors’
fees,
design
 conAngency,
installed
 instruments)
 $1,053,262
±
30%
 
 Opera8ng
Cost
(Yearly)


  • Labour


$40,000
×
4


  • Electricity


‐
6
kW.s/L
of
feed
required


‐
Cost:
8
cents/kWh

 $23,841
 Maintenance
 5‐10%
of
Capital
Cost


Disk‐Bowl
Centrifuge
for
Orange
Juice
 Clarifica8on


References:


[1]
Geankoplis,
C.J.
"Transport
Processes
and
SeparaAon
Process
Principles",
Chapter
14
 [2]
Leung,
Wallace
W,
Centrifugal
SeperaAons
in
Biotechnology,
Elsevier
Science
&
Technology,
2007


slide-20
SLIDE 20

Anderson Pang 0953378 Cereal Separation: From Corn to Starch

slide-21
SLIDE 21

Σ = 2πω2(𝑂 − 1)(𝑠2

3 − 𝑠1 3)

3𝑕𝑢𝑏𝑜θ μ 𝑝 = (ρ𝑡𝑢𝑏𝑠𝑑ℎ − ρ𝑕𝑚𝑣𝑢𝑓𝑜)𝑕𝑒2 18μ Qcut = 2vTSV Σ Qcut =250 000L/h dmax=6.2 μm din=1m dout=0.25m N=160 μ 𝑝 =1.702*10^-10 m/s Σ = 2.06 ∗ 1011 𝑛2 ω= 2471.49 corn starch density =660 kg/m3 corn gluten density=400 kg/m3 θ= 45o $11,356.8 per year. Powered required is 160 kW Estimated cost from alibaba.com are $100 000 USD per unit. Anderson Pang 0953378

slide-22
SLIDE 22

References [1] "Start from Corn Separation technology for cereals." GEA Mechanical Equipment 1 (2012): 8. GEA Westfalia Separator Group. Web. 17 Oct. 2012. [2] Dunn, Kevin . "Separation Processes." 4M03 Seperation Processes. N.p., 10 Oct. 2012. Web. 17 Nov. 2012. <http://learnche.mcmaster.ca/wiki_4M3/images/a/a7/2012-4M3-class-03B.pdf>. [3] Dr. A. Margaritis,. "5. Centrifugation Processes." University of Waterloo. N.p., n.d. Web. 17

  • Nov. 2012.

<http://www.eng.uwo.ca/people/amargaritis/Margaritis%20CBE%20403a%20Fall%202007/CBE %20403a%20Course%20Notes%205%20%28centrifugation%20processes%29%20F%202007.pdf >. Anderson Pang 0953378 [4] Dunn, Kevin . "The Design And Sizing Of A Centrifuge For SAB." University of Cape Town 1 (1998): 12. Print.

slide-23
SLIDE 23
  • Recovers metals from solutions

by electrochemical reactions

  • Reactions are heterogeneous
  • Cathodic and Anodic Ones
  • electrons are transferred from

the cathode

  • Ni2+ + 2e- → Ni
  • Electrons are transferred to

the anode

  • 2H2O - 4e- → O2 + 4H+
  • An electrowinning unit consists of an

electrolytic cell a rectifier and a pump. The electrolytic cell is composed of a tank where cathodes and anodes are supplied with electrical potential. The rectifier converts AC into DC current, and the pump causes the solution of Ni2+ and cd2+ as well as Fe3+ to flow through the unit. Electrowinning Cell Mechanism

slide-24
SLIDE 24

Costing of an Electrowinning Cell Assumptions Installation Costs are Included Operated for 300 days a year 9 hours a day 20000 tons of batteries are recycled per year Source Operating Costs Labour and Maintenance ($10 /hour in directly due to monitoring) $ 27, 000 Energy (0.07CDN/KWh) $217,000 Electrode Replacement ($200 each) $20,000 Capital Cost Electrolytic Cell and Installation (4 Units 4000 Amperes) $300 000

Ewa Rudnik, Marek Nikiel, Hydrometallurgical recovery of cadmium and nickel from spent Ni–Cd batteries, Hydrometallurgy, Volume 89, Issues 1–2, September 2007, Pages 61-71, ISSN 0304-386X, 10.1016/j.hydromet.2007.05.006. (http://www.sciencedirect.com/science/article/pii/S0304386X07001144) Keywords: Cadmium; Nickel; Electrowinning; Leaching; Ni–Cd batteries http://biomine.brgm.fr/

slide-25
SLIDE 25

Seawater Desalination

Nada Hosni Maiyeah Ly

Reverse Osmosis unit for desalination of seawater

slide-26
SLIDE 26

With 15% downtime annually and an average flow rate of 24.8 million gallons/day:

References:

  • Jamal, K., M. A. Khan, and M. Kamil. "Mathematical Modeling of Reverse Osmosis Systems."

Desalination 160 (2004): 29-42. Science Direct. Web. 6 Nov. 2012.

  • Bartman, Alex R., Aihua Zhu, Panagiotis D. Christofides, and Yoram Cohen. "Minimizing

Energy Consumption in Reverse Osmosis Membrane Desalination Using Optimization-based Control." Journal of Process Control 20.10 (2010): 1261-269. Science Direct. Web. 14 Nov. 2012.

slide-27
SLIDE 27

Design Equations of a Scrubber

ηspray efficiency = 1-exp((-3RL/2DdG)ηsingle drop) ηfilter efficiency = 1-exp(-fηsingle body)

mdust in = mremoved by spray + mremoved by filter + mdust escaped mremoved by spray= mdust in (ηspray efficiency ) mremoved by filter = mremoved by spray(ηfilter efficiency )

   

) 1 ( 4      

f

D h vol/s ilter, gas e entire f through th tric flow gas volume vol/s ibers, gas swept by f tric flow gas volume f

Combining the 3 mass equations: mdust in(1- ηspray efficiency(1+ ηfilter efficiency)= mdust escaped

   

width) ss)(filter er thickne ight)(filt (filter he ter) ers in fil )(# of fib

  • ne fiber

(volume of ume filter vol me fiber volu α  

slide-28
SLIDE 28

Cost Estimation

Cost of Unit(1970)=(3100)(3140/5000)0.7=$2238 Today's Unit Cost=(2238)(1490/300)0.7=$6874 Today’s Fan Cost = $836 Today’s Pump Cost = $2984 Total Cost = $10694±40% Power Ratings for pump and fan were calculated to be 740Watts and 10kWatts respectively. Estimate 8000 working hours per year with electricity cost of 9cents/kWh. Total Electricity Cost: (0.74kW+10kW)(8000hrs/year)($0.09/kWh) = $7733/year