
SLIDE 1
SEMIRARA MINING & POWER CORPORATION
Comp
- mpany
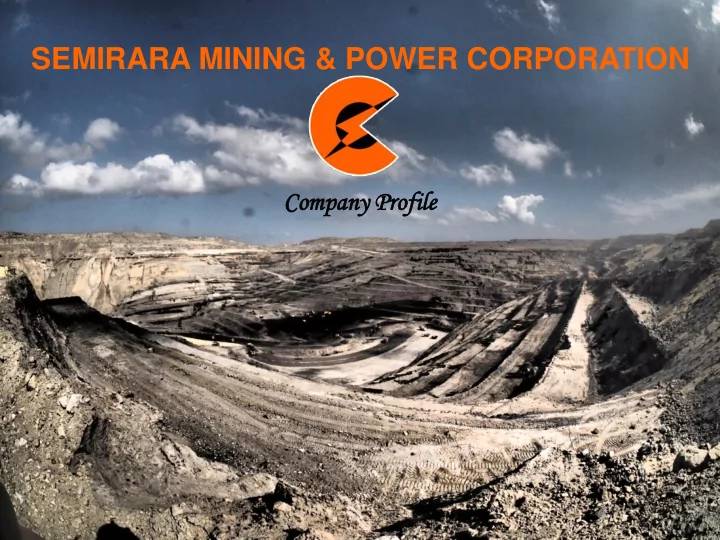
SEMIRARA MINING & POWER CORPORATION Comp ompany any Profile - - PowerPoint PPT Presentation
SEMIRARA MINING & POWER CORPORATION Comp ompany any Profile file VISION, MISSION AND VALUES Our Vision: COAL Towards An Energy-Sufficient Philippines Our Mission: To fulfill its commitment to provide affordable power to the Filipino people
Our Vision: COAL Towards An Energy-Sufficient Philippines Our Mission: To fulfill its commitment to provide affordable power to the Filipino people through the responsible use of coal as energy source, Semirara Mining and Power Corporation will continue to remain as:
power producer in the Philippines
promote the use of coal as a reliable and economical power source.
engaging in the judicious use and rational conservation of the country’s natural resources. Our Values: In fulfilling our vision, we are guided by : Teamwork that enables us to work toward common goals; Excellence that drives us to deliver outstanding results; Loyalty that keeps us steadfast over challenges and time; Integrity that upholds the cornerstone of our business ethics; Commitment that fuels realization of our mission; and Professionalism that embodies our work quality.
A member of the DMCI Holdings, Inc. group of companies
Sem-Calaca Power Corp. *Southwest Luzon Power Generation Corp. *Sem-Cal Industrial Park Developers, Inc. *Semirara Claystone, Inc. *Semirara Energy Utilities, Inc. *St. Raphael Power Generation Corp. *Sem- Balayan Power Power Generation Corp. 100% 100% 100% 100% 100% 100% 100% Sem-Calaca RES Corp.
The only vertically integrated coal-fired power plants in the Philippines
in the country that accounts for 97% of the total domestic production
power plants Low coal production cost
in the country, with 168.7 million tons of mineable reserves
house
income tax and government royalties Strong engineering core competence
brand of engineering that provides innovative engineering solutions
Semirara Island
Manila 350 Km. San Jose
50 Km. Libertad Antique 85 Km. Calaca Batangas 250 Km. Boracay/ Caticlan 60 Km.
ISLAND PROFILE Semirara Island, Caluya Province of Antique Land Area = 55 sq. km. or 5,500 hectares Three (3) Barangays Nine (9) Sitios Population ~ 16,661 Livelihood – Fishing & Farming
inter-connected
2 x 300 MW SEM-Calaca Power Corp Coal-Fired Power Plant
67 hectares
south of Manila
Semirara Island
Incorporated in the Philippines as a limited liability company
Initial public offering, listing on the Philippines Stock Exchange
Commercial production at the Unong mine commenced
DMCI Holdings, Inc. (DMCI-HI ) purchased 40% interest in Semirara
Debt to equity conversion increased DMCI-HI’s interest to 74% Installation of coal washing plant
New management team installed by DMCI-HI
Unong mine depleted, operations commenced at Panian; Full shift from continuous to conventional mining system;
Capital restructuring increased DMCI-HI’s interest to 94.5%; Declared stock dividend of PHP225m, consisting of 225m common shares; Authorized capital increased to 1b shares
International and Domestic Offering of 105.046m shares, comprising of 46.875m primary shares and 58.171m secondary offering, increased outstanding common shares to 296.875m; DMCI-HI’s interest reduced to 60%
Maiden voyage carrying 28.8K MTs of coal to Xiamen, China SEC’s Top 20 PLCs for Corporate Governance
Coal Operating Contract is extended up to 14 July 2027 BOI Registration as expanding coal producer ISO Certifications – ISO 9001:2000, ISO14001:2004, OHSAS 18001:2007 Exploratory drilling activities indicated substantial coal deposits Silver Awardee for SEC’s Top PLCs for Corporate Governance
Acquisition of 2 x 300 MW Calaca power plants (Sem-Calaca Power Generation Corp.) Silver Awardee for SEC’s Top PLCs for Corporate Governance
Stock Rights Offering of 59.375m shares increased outstanding common shares to 356.25m Silver Awardee for SEC’s Top PLCs for Corporate Governance Most Committed to a Strong Dividend Policy, Finance Asia Magazine’s 10th Annual Best Managed Company’s Poll
Financial close of PHP 11.5 billion project debt facility to finance Phase 1 expansion Commence Phase I power expansion of 2x150 MW in Calaca (Southwest Luzon Power Generation Corp.) BOI Registration of Narra Mine under non-pioneer status, maximum of 8 years
2nd Runner Up, ASEAN Best Practices in Coal Projects – CSR category, 2013 ASEAN Coal Energy Awards 6th among Most Committed to a Strong Dividend Policy, Finance Asia Magazine’s 13th Annual Best Managed Company’s Poll Among the top 10 finalists (out of 289 PLCs) in 2013 PSE Bell Awards for Corporate Governance Awarded 2 new mining areas (Mindoro and Mindanao) Incorporated 2 new corporations for power capacity expansion
4th among Most Committed to a Strong Dividend Policy and 9th Best Corporate Social Responsibility, Finance Asia Magazine’s 14th Annual Best Managed Company’s Poll
BOI Registration of Molave Mine under non-pioneer status, maximum of 10 years Amendment of ECC to increase mining capacity to maximum of 16 million tons
NARRA PIT 70 mil. Mt Reserves
UNONG PIT 12 mil. Mt
( Depleted )
Total Land Area = 55 sq.km (5,500 hectares)
PANIAN PIT (ACTIVE) 8 mil. Mt Remaining reserves HIMALIAN 80.0 mil. Mt Reserves
MOLAVE PIT 80 mil. Mt Newly Discovered Resources
Limestone Resources
Panian
Himalian Unong
BUNLAO SPRING
Stacks 300MW Unit 1
300MW Unit 2
NGCP Switchyard Coal Yard Powerhouse Electrostatic Precipitator Boiler Coal Unloading Facility
Coal Unloading Facility Transfer Tower Coal Yard Silo Stacker/Reclaimer Conveyor
EQUIPMENT UNIT 1 UNIT 2 Steam Generator Foster Wheeler (FWEC), USA Asea Brown Boveri/ Combustion Eng’g (ABB-CE), USA Steam Turbine Toshiba, Japan GEC-Alsthom, France Electric Generator Toshiba, Japan GEC-Alsthom, France Condenser Toshiba, Japan GEC-Alsthom, France EPC Mitsui and Co., Japan Mitsubishi, Japan
Wast ste S Strippin ipping
Clean Coal Washable Coal
Co Coal l Extr Extraction ion
Ha Hauling, Stoc Stockpiling
Washing Blending & Pre-acceptance Shiploading
2009 2010 2011 2012 2013 2014 2015 2016 LOADING 16 m3 Excavators 7 7 8 16 2 4 4 4 15 m3 Excavators 2 5 5 5 8 8 9 9 12 m3 Excavators 4 4 4 4 8 8 11 11 7 m3 Excavators 4 2 2 2 2 1 1 1 TOTAL 17 18 19 27 20 21 25 25 HAULING 100-tonne Dump Trucks 102 121 121 120 107 120 112 125 SUPPORT Dozers 19 29 26 25 25 25 21 25 Motor Graders 6 6 6 6 5 5 6 6 Water Trucks 4 6 6 7 4 4 4 4 Small Power Shovels 10 12 15 12 14 14 10 10 Crusher 2 2
2 2 4 4 4 4 Drilling Machine / Eqpt 1 21 21 20 26 26 Drilling Machine / Eqpt 1 1 TOTAL 41 55 56 73 73 72 72 76 FLEET CAPACITY (M bcm) 62 80 85 80 82 82 88 88 EQUIPMENT # OF UNITS
1,000 2,000 3,000 4,000 5,000 6,000 7,000 8,000 9,000 1997 1998 1999 2000 2001 2002 2003 2004 2005 2006 2007 2008 2009 2010 2011 2012 2013 2014 2015 In thousand MTs
Unong closed; Start of Panian
Started exporting 1997 Start of Unong operations 1983 Start of Coal Production at 177,858 MTs 1984 Introduction of bucketwheel operation DMC acquired SCC Record Production: 8.5 M MTs
Total: 8.17 M MTs
SEMIRARA 8,160,966 MTs 97% ZAMBOANGA 13,748 MTs 0% CEBU 42,621 MTs 1% ALBAY 21,683 MTs 0% SURIGAO 57,099 MTs 0% SSCM 112,267 MTs 1%
Source: DOE
500 1,000 1,500 2,000 2,500 3,000 3,500 4,000 4,500
1984 1985 1986 1987 1988 1989 1990 1991 1992 1993 1994 1995 1996 1997 1998 1999 2000 2001 2002 2003 2004 2005 2006 2007 2008 2009 2010 2011 2012 2013 2014 2015
In GWh Unit 1 Unit 2
Acquired by SCC
Unit 1 = used blended coal (imported/local)
KEY PARAMETERS (UNIT 1) PRE-REHAB (2010) POST-REHAB (2013) Net Heate Rate; BTU/Kwh 12,140 10,438 Capability; MW 150 245 Availability; % 69 83 Coal usage; MT/Nkwhr 0.705 0.60 KEY PARAMETERS (UNIT 2) PRE-REHAB (2009) POST-REHAB (2011-2013) Net Heate Rate; BTU/Kwh 11,375 11,162 Capability; MW 200 300 Availability; % 65 79 Coal usage; MT/Nkwhr 0.65 0.66
Rehab Period: 8 August 2010 – 6 November 2010 Rehab Period: 29 August 2011 – 4 August 2012
Asia Pacific Energy Corp.
Pampanga
Panay Energy Development Corp. Iloilo, City Petron Corp.
Lima, Bataan
APO Cement Corp. Naga, Cebu Toledo Power Corp. Toledo City, Cebu Jet Power Corp. North Harbor, Manila Sem-Calaca Power Corp. San Rafael, Calaca, Batangas PNOC Exploration Corp. North Harbor, Manila Eagle Cement Corp. Bulacan HOLCIM Philippines Inc. Norzagaray, Bulacan Solid Cement Corp. Antipolo City, Rizal Cebu Energy Dev’t Corp. Toledo City, Cebu Lafarge Cement Corp. Bulacan Lafarge-Republic Cement Corp. Batangas United Pulp and Paper Co., Inc. Calumpit, Bulacan
Cement Plants Power Plants Other Plants
2,000 3,000 4,000 5,000 6,000 7,000 8,000 9,000 10,000
Total Sales Local Sales 18-year average annual growth rate. Total sales – 15%; Local sales – 12%; Philippine total consumption – 8%
*inclusive of 467K MTs of unwashed coal delivered to SLPGC
Total Local Consumption: 22.01 M MTs
Power Plants
17,553,854 MTs 80%
Cement Plants
3,348,362 MTs 15%
Industrial Plants
1,104,185 MTs 5%
Source: DOE
24% 76%
0% 20% 40% 60% 80% 100%
Others SCC
2 x 647 MW Sual Coal-Fired Power Plant, Pangasinan (TeaM Energy) 25 MW CFB UPPC Coal- Fired Power Plant, Bulacan (UPPC) 2 x 315 MW Masinloc Coal- Fired Power Plant, Pangasinan (AES) 50 MW CFB APEC Coal-Fired Power Plant, Pampanga (TIPCO) 2 x 600 MW CFB Mariveles Coal-Fired Power Plant, Bataan (GN Power) 2012 70 MW Petron Coal-Fired Power Plant, Limay Bataan 2 x 300 MW Batangas Coal- Power Plant, (SEM-Calaca/DMCI Group) 456 MW QPPL Coal-Fired Power Plant, (Quezon Power) 2 x 382 MW Pagbilao Coal- Fired Power Plant, Quezon (TeamM Energy) 2 x 82 MW CFB PEDC, Iloilo (Global Business Power Corp.) 3 x 82 MW CFB CEDC, Cebu (Global Business Power Corp.) 2 x 50 MW CFB CTPP, Cebu (Salcon Power Corp.) 2 x 100 MW CFB KSPC, Cebu (KEPCO-Salcon) 89 MW Toledo Power Corp., Cebu (Global Business Power Corp.) 2 x 10⁵ MW Mindanao Coal- Fired Power Plant, Misamis Oriental (STEAG)
Source: DOE
Luzon Grid Committed Power Projects
Proponent Location Type Rated Capacity Project Costs Target (MW) (PHP Billion) Commissioning South Luzon Thermal Energy Corp. (SLTEC) Puting Bato, West, Calaca, Batangas Coal-Fired 135.0 12.9 August 2014 South Luzon Thermal Energy Corp. (SLTEC) Puting Bato, West, Calaca, Batangas Coal-Fired 135.0 9.6 November 2015 Southwest Luzon Power Generation Corp. (SLPGC) San Rafael, Calaca, Batangas Coal-Fired 300.0 45.4 October 2014 San Jose 1 Power Corp.
Biomass 9.9 1.2 November 2014 Energy Development Corp. Sitio Burgos, Ilocos Wind 87.0 32 December 2014 TOTAL 666.9 101.1
Visayas Grid Committed Power Projects
Proponent Location Type Rated Capacity Project Costs Target (MW) (PHP Billion) Commissioning Toledo Power Corporation Toledo City, Cebu Coal-Fired 82.0 10.2 September 2014 Energy Development Corp. Nasuji, Valencia, Negros Or. Geothermal 50.0 4.0 August 2014 Sunwest Water & Electric Co., Inc.
Hydro 8.0 1.4 May 2014 San Carlos BioPower Corp. San Carlos City, Negros Occ. Biomass 18.0 1.7 March 2015 Petrogreen Energy Corp.
Wind 50.0 5.4 December 2014 Trans-Asia Oil Renewable Energy Corp. San Lorenzo, Guimaras Wind 54.0 4.3 August 2014 TOTAL 262.0 27
Mindanao Grid Committed Power Projects
Proponent Location Type Rated Capacity Project Costs Target (MW) (PHP Billion) Commissioning Peak Power Soccsargen Inc. SocSarGen Biomass 20.9 0.250 September 2014 Peakpower San Francisco Inc. SocSarGen Biomass 5.2 September 2014 Therma South, Inc.
Coal-Fired 150.0 12.0 March 2015
TOTAL 176.1 12.25
Source: DOE/ERDB, 11 Jul 2012
Fuel Type Installed Capacity Dependable Capacity Total Luzon Visayas Mindanao Luzon Visayas Mindanao Installed Dependable Coal 4,738 822 382 4,446 679 360 5,942 5,486 Natural Gas 2,801 2,739 2,801 2,739 Geothermal 938 1,071 109 513 741 98 2,117 1,352 Oil-Based 2,232 677 799 1,059 239 718 3,708 2,015 Diesel Oil 802 621 799 539 239 718 2,222 1,495 Oil Thermal 650 650 Gas Turbine 780 56 520 836 520 Hydro 2,487 10 1,061 1,132 1 837 3,558 1,970 Available Capacity 13,196 2,580 2,351 9,888 1,660 2,013 18,126 13,562 Other RE 407 152 37 157 63 10 595 230 Biomass 71 42 36 48 17 10 149 75 Solar 53 20 1 22 11 74 33 Wind 283 90 87 35 373 122 Total Capacity 13,602 2,732 2,387 10,045 1,723 1,873 18,721 13,792
*Plants on Commissioning but not yet on Commercial Operations are not included in the list
Source: DOE
Source: DOE
Source: DOE
(5,000)
10,000 15,000 20,000 25,000 30,000 35,000
Revenues NIAT
7% 28% 29% 13% 10% 9% 15% 17% 23% 26% 28% 24% 34%
NP Ratio
1997 1998 1999 2000 2001 2002 2003 2004 2005 2006 2007 2008 2009* 2010* 2011* 2012* 2013* 2014* 2015* Assets 2,598 3,506 3,679 2,736 3,240 3,413 3,099 3,862 6,928 6,511 6,558 6,111 24,26 30,49 35,62 36,18 44,72 51,90 57,15 Liabilities 2,353 2,248 2,729 2,853 3,379 3,546 3,094 2,502 2,736 2,197 1,944 1,811 14,38 18,15 20,82 19,29 24,60 29,19 30,25 Equity 245 1,258 951 (117) (139) (249) 6 1,361 4,192 4,315 4,615 4,301 9,884 12,34 14,80 16,89 20,12 22,70 26,90
10,000 20,000 30,000 40,000 50,000 60,000
Dividend Policy Payout Ratio
0.4 0.4 1.3 2.0 2.0 3.3 4.0 4.0 4.0 4.0 4.0
500 1,000 1,500 2,000 2,500 3,000 3,500 4,000 4,500 1 1 2 2 3 3 4 4 5
2006 2007 2008 2009 2010 2011 2012 2013 2014 2015 2016
Total dividends (In million PHP) Dividend per share (In PHP)
21% 55% 175% 209% 101% 143% 78% 81% 80% 55% 63%
20% of previous year’s NIAT
IPO Price: PHP 36 SRO Acquisition of Sem-Calaca US Debt Crisis Export maiden voyage Subprime Crisis Shares Buyback PhP 12 dividend declaration West Wall Slide 200% stock dividends North Wall Slide Resumption
Current Market Market Share Market Growth Opportunities Coal
Annual Production: 8M MTs 2014 Annual Domestic Consumption: 20.16 M MTs 97% in production 18% in consumption 8% annual growth rate in domestic coal consumption
production of 16 M MTs
acceptable to new coal-fired plants
a captured market for coal
Power
National Installed Capacity at 18.7 GW and Dependable Capacity at 13.8 GW 600 MW or 12.7% of coal-fired power plants 5% annual demand growth expected 2.9GW of capacity coming online up to 2019
its power business to up to 1,800 MW.
plants, SCC is the lowest cost producer, thereby making it competitive in a tight market.
37% of the total Mining and Power workforce of 4,414 are from Western Visayas,22% from Calabarzon, 7% from NCR and 34% from other regions.