
SLIDE 1
Self Self-
- Employed Immigrants
Employed Immigrants
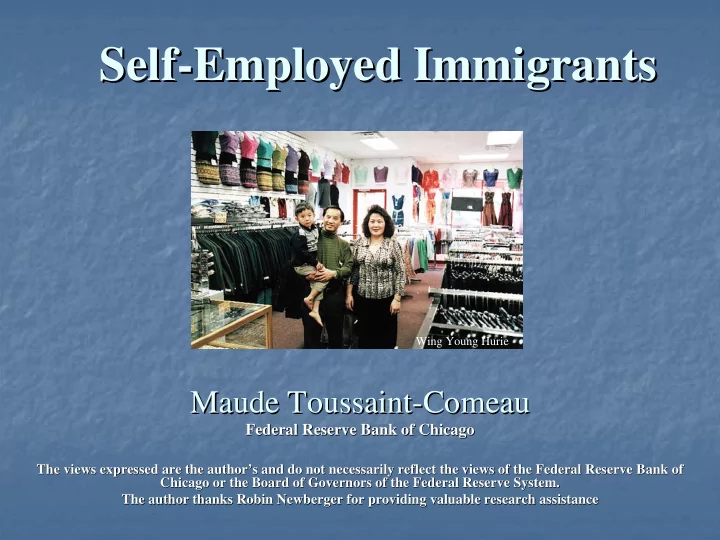
Wing Young Hurie
Maude Toussaint Maude Toussaint-
- Comeau
Comeau
Federal Reserve Bank of Chicago Federal Reserve Bank of Chicago
The views expressed are the author’s and do not necessarily refl The views expressed are the author’s and do not necessarily reflect the views of the Federal Reserve Bank of ect the views of the Federal Reserve Bank of Chicago or the Board of Governors of the Federal Reserve System. Chicago or the Board of Governors of the Federal Reserve System. The author thanks Robin Newberger for providing valuable researc The author thanks Robin Newberger for providing valuable research assistance h assistance