
SLIDE 1
Segmentation and Contour Detection
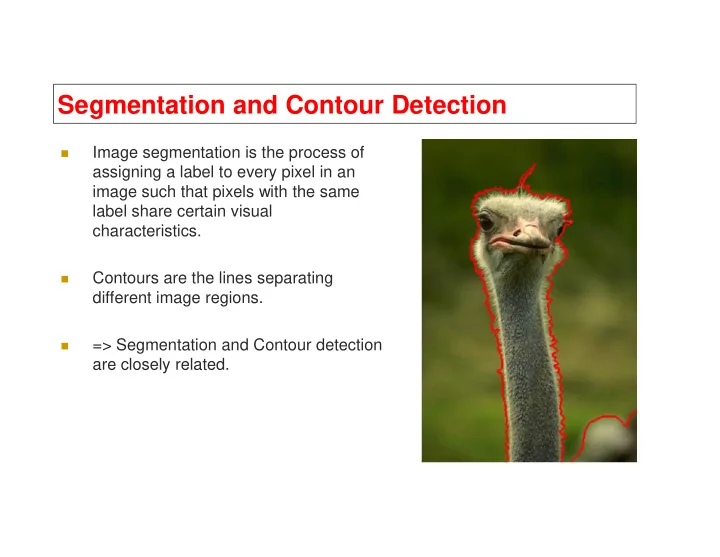
Image segmentation is the process of assigning a label to every pixel in an image such that pixels with the same label share certain visual characteristics.
Contours are the lines separating
Contours are the lines separating different image regions.
=> Segmentation and Contour detection are closely related.