
SLIDE 1
Seeing What We Need to See vs. What We Hope to See
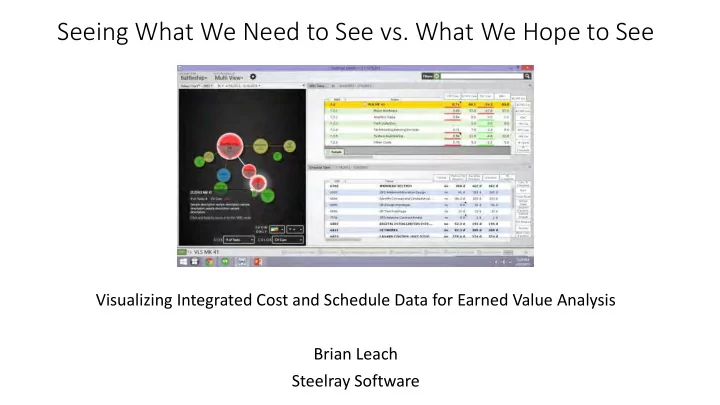
Visualizing Integrated Cost and Schedule Data for Earned Value Analysis Brian Leach Steelray Software
Seeing What We Need to See vs. What We Hope to See Visualizing - - PowerPoint PPT Presentation
Seeing What We Need to See vs. What We Hope to See Visualizing Integrated Cost and Schedule Data for Earned Value Analysis Brian Leach Steelray Software Objectives Review the Purpose of Visualization, especially as it pertains to EVM
Seeing What We Need to See vs. What We Hope to See
Visualizing Integrated Cost and Schedule Data for Earned Value Analysis Brian Leach Steelray Software
especially as it pertains to EVM Analysis
impede EVM Visualization
issues and obstacles
can be integrated
views
From The Visual Display of Quantitative Information, by Edward Tufte:
system, numbers, symbols, words, shading, and color.”
depending on your perspective.
doesn’t work -- is much more recent, taking place in the past few decades.
Statisticians and analysts have a simple success criteria, stated by Nathan Yau: “If a graphic or interactive doesn’t help in analysis, then it’s not
FlowingData Guide to Design, Visualization, and Statistics
multiple sources.
measurement plan (the planned value) is typically found in the project’s scheduling system.
measured against the planned value and is also typically found in the scheduling system.
account, and these typically are found in the project’s cost system.
COST IMS
TEAM PLAN
TEAM PLAN
Conversion and Export/Import
From the October 2006 DoD EVM Implementation Guide:
required for all reports unless disclosure of this information would compromise national security. All data should be in a readable digital format (e.g., pdf files are not acceptable). The ANSI X12 standard (839 transaction set), the United Nations Electronic Data Interchange for Administration, Commerce and Transport (UN/EDIFACT) standard (PROCST message), or the XML equivalent are the accepted formats. On-line access to the data may be provided to augment formal submission. Requirements to submit reports by electronic means are included in the CDRL. If technology is not available to support X12 or XML IMS data submission, the IMS should be delivered electronically in the native digital format.
X12 standard for earned value management (EVM) but no agreement was reached to normalize schedule planning and execution information across disparate proprietary software applications.
industry skepticism and resistance from software vendors.
Program Management Systems Committee) worked on breaking the stalemate.
vendors on an XML standard, a consensus was reached and the XML standard accepted by DoD’s Performance Assessments and Root Cause Analyses (PARCA) office.
July 1, 2012: PARCA releases the IPMR DID
integration of the schedule and cost data for performance reporting.
changes from the ANSI X12 standard to the UN/CEFACT XML standard.
Cost Schedule
The XML cost data contains a tree of WBS elements with an ID representing the WBS code.
In Format 6 (the XML version of the IMS): <ProjectScheduleTask> <WorkPackageID>wbs code</WorkPackageID> <ControlAccountID>wbs code</ControlAccountID> <DataNodeID>wbs code</DataNodeID> : : </ProjectScheduleTask> 1 2 3
From 2012 to the present, vendors supported exporting the IPMR standard, including:
There is strong business value in the analysis of their integration.
control system, the big picture must be considered. One of the key questions to ask and concepts to clarify is the around the business value that the system delivers.
If the visualization and the analysis that it supports doesn’t bring significant incremental business value, it is probably not worth the effort.
can be done more quickly or a more thorough analysis can be done in the same amount of time.
difficult or impossible to uncover.
Dimension – Z(oom)