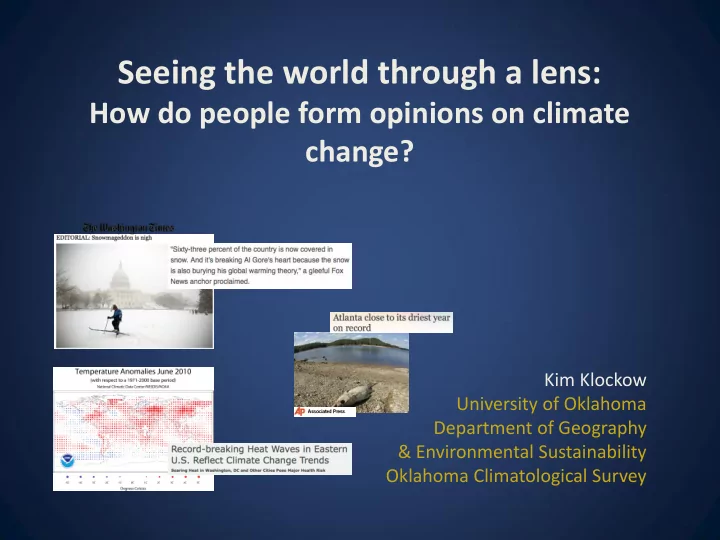
Seeing the world through a lens: How do people form opinions on - - PowerPoint PPT Presentation

seeing the world through a lens
SMART_READER_LITE
LIVE PREVIEW

Seeing the world through a lens: How do people form opinions on - - PowerPoint PPT Presentation

Seeing the world through a lens: How do people form opinions on climate change? Kim Klockow University of Oklahoma Department of Geography & Environmental Sustainability Oklahoma Climatological Survey Funding provided by Sandia Labs Dr.


slide-1
SLIDE 1

Seeing the world through a lens:

How do people form opinions on climate change?

Kim Klockow University of Oklahoma Department of Geography & Environmental Sustainability Oklahoma Climatological Survey

slide-2
SLIDE 2
  • Dr. Hank Jenkins-Smith

University of Oklahoma Department of Political Science

  • Dr. Kevin Goebbert

Valparaiso University Department of Geography and Meteorology Matt Nowlin University of Oklahoma Department of Political Science

Funding provided by Sandia Labs

slide-3
SLIDE 3

Research Introduction

  • Key Question:

What drives individual beliefs about anthropogenic climate change?

  • A few propositions:

– They use weather changes as evidence (a different attribution problem -> attributing weather events to climate change) – They use socio-political cues (e.g., partisanship, ideology) – They are guided by cultural values

slide-4
SLIDE 4

Cultural Cognition –

A Conception of CTR

  • Four mechanisms, from social/cognitive psychology:

– Identity-protective cognition

  • Hard for anyone to see anything wrong with whatever they

identify with most; desire to live in social harmony

– Biased assimilation and group polarization

  • Give credit to information that reinforces a priori beliefs

– Cultural credibility heuristic

  • People don’t fully “understand” risks, they use perceived experts

who share their values as proxies

– Cultural-identity affirmation

  • People dismiss information that is discordant with their values
slide-5
SLIDE 5

Cultural Theory of Risk

Cultural cognition framework (Kahan 2010)

slide-6
SLIDE 6

Survey Data

Questions cover several areas of risk concern, including nuclear, pollution, and climate hazard.

– Responses geocoded

  • Zip & Fips

– Three years of data (2007 - 2012)

  • Total ~7500 participants

– Surveys taken largely in May – Multimodal – internet and telephone data collection

slide-7
SLIDE 7
  • Egalitarian: What society needs is a fairness

revolution to make the distribution of goods more equal.

  • Hierarch: Society would be much better off if we

imposed strict and swift punishment on those who break the rules.

  • Individualist: Even the disadvantaged should have to

make their own way in the world.

Select questions from the survey

slide-8
SLIDE 8

Meteorological Data

  • NCEP NCAR Reanalysis 2.5 degree grid spacing (Kalnay et al.

1996)

  • Match zip/fip to nearest grid point as representative region
  • Daily avg 2m temperature
  • Deviation schemes used to match perceptions

– (Prior week avg - 3 yr avg) – (Prior year avg - 3 yr avg)

slide-9
SLIDE 9
  • Weather perception:

– Temperature: In your personal experience, over the past few years have average temperatures where you live been rising, falling, or staying about the same as previous years? – Drought: In your personal experience, over the past few years has drought where you live been more frequent, less frequent, or stayed about the same as previous years? – Floods: In your personal experience, over the past few years has flooding where you live been more frequent, less frequent, or stayed about the same as previous years?

Select questions from the survey

slide-10
SLIDE 10

Select questions from the survey

  • CC beliefs: In your view, are greenhouse gases, such

as those resulting from the combustion of coal, oil, natural gas, and other materials causing average global temperatures to rise?

  • Environmental risk: On the scale from zero to ten,

where zero means no risk and ten means extreme risk, how much risk do you think global warming poses for people and the environment?

slide-11
SLIDE 11

Predicted Probability of Perceiving Local Temperatures as Increasing by Affinity to Cultural Type

slide-12
SLIDE 12

Predicted Probability of Perceiving Local Temperature, Drought and Floods as Increasing by Departures from Long-Term Averages

slide-13
SLIDE 13

Weather conflation with climate

slide-14
SLIDE 14
slide-15
SLIDE 15
slide-16
SLIDE 16

Factors predicting belief in anthropogenic cause of climate change

Variable Estimated coefficient Significance level (Intercept) 2.597 *** Temperature Perception 2.154 *** Week-3yr T

  • 0.012

Yr-3yr T 0.058 Gender 0.096 Age 0.002 Education 0.153 * Income 0.001 Democrat 0.8936331 *** Ideology

  • 0.8510312

*** Egalitarianism 0.2522954 ***

Multiple R-squared: 0.225, Adjusted R-squared: 0.2232 F-statistic: 125.6 on 10 and 4324 DF, p-value: < 2.2e-16 Significance codes: 0 '***' 0.001 '**' 0.01 '*' 0.05 '.’ 0.1 ' ' 1

slide-17
SLIDE 17

From Dan Kahan

slide-18
SLIDE 18

From Dan Kahan

slide-19
SLIDE 19

Take-home messages

  • Perceptions of weather are important to climate change

beliefs, attenuated by lenses of culture and ideology

  • Weather communication landscape is complex, potentially

politicized, and important

  • Role for multiple policies in climate change discussion
slide-20
SLIDE 20

Contact information:

  • Dr. Hank Jenkins-Smith

hjsmith@ou.edu Kim Klockow kklockow@ou.edu

Thank you! Questions?