sas ab
play

SAS AB 7. Financials 8. Outlook 2002 Result Analyst Presentation - PDF document

Table of contents 1. Summary of 3 rd Quarter 2002 2. Result improvement measures 3. Business area Scandinavian Airlines 4. Business area Subsidiary Airlines & Affilliates 5. Business area Airline related 6. Business area


  1. Table of contents 1. Summary of 3 rd Quarter 2002 2. Result improvement measures 3. Business area – Scandinavian Airlines 4. Business area –Subsidiary Airlines & Affilliates 5. Business area – Airline related 6. Business area – Rezidor SAS Hospitality SAS AB 7. Financials 8. Outlook 2002 Result Analyst Presentation 9. Appendices Third Quarter 2002, November 13 Stockholm, London 2 11/12/2002 Important events of note 3 rd Quarter 3 rd Quarter 2002 – according to set out Rezidor SAS investing in multi-brand concept plan, yields and revenues under pressure Regent, Country Inns, Park Inn 1 st Quarter – weak - according to plan Scandinavian Airlines launches additional low price internet booking alternatives to most 2 nd Quarter – according to plan – passenger load European cities factors and yields better than expected SAS Flight Support to acquire ASG –name 3 rd Quarter – according to plan – yields & change to European Aeronautical Group revenues under pressure Scandinavian Airlines structural improvement Pressure on revenues expected for 4 th Quarter measures – Verification process completed Expected economic recovery delayed – Increased target to MSEK 6 400 (4 000) Restructuring charge of MSEK 600 – Restructuring charge of MSEK 600 Q4 3 11/12/2002 4 11/12/2002 Increased transparency through five Business Areas 
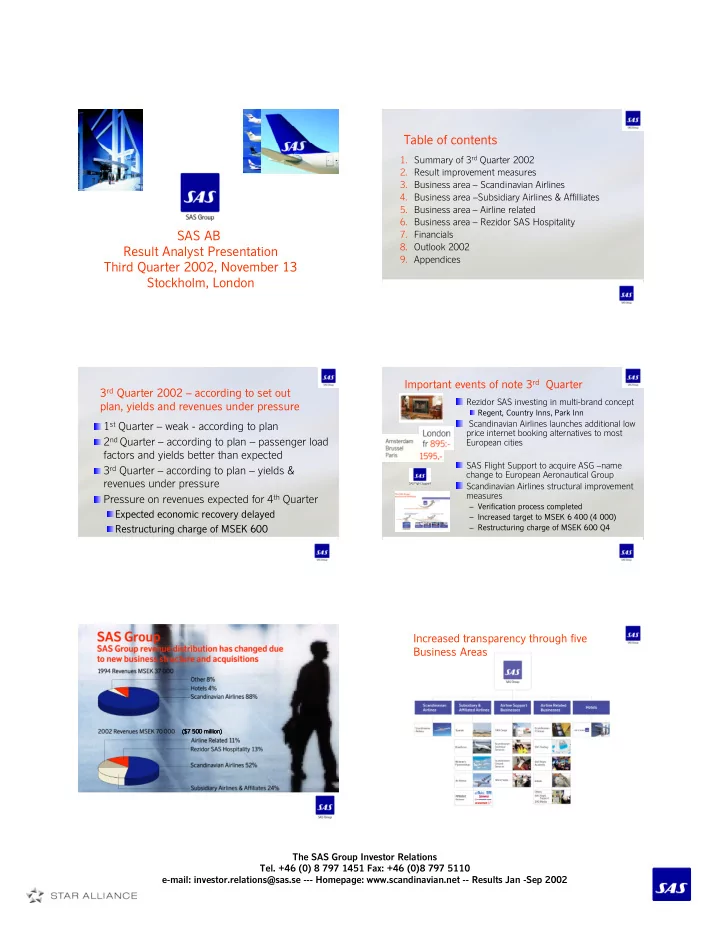
($7 500 million) ($7 500 million) ($7 500 million) ($7 500 million) 5 11/12/2002 The SAS Group Investor Relations Tel. +46 (0) 8 797 1451 Fax: +46 (0)8 797 5110 e-mail: investor.relations@sas.se --- Homepage: www.scandinavian.net -- Results Jan -Sep 2002

  2. Significant uplift in 2 nd and 3 rd Record cabin factors but pressure on yields Quarter compared with 1 st Quarter 2002 in Scandinavian Airlines Summary of income statement (MSEK) Actual Actual Q1 Actual Actual Q1 Q1 Q1 Actual Q2 Actual Actual Actual Q2 Q2 Q2 Actual Actual Actual Q3 Actual Q3 Q3 Q3 Jan Jan- Jan Jan - -Sep 02 - Sep 02 Sep 02 Sep 02 � Total traffic increased by 32,2% vs. Q3 2001 Operating revenues 13 775 17 868 16 592 48 235 -13 191 -14 620 -14 462 -42 273 Operating costs – Group passenger load factors at record levels 584 584 584 584 3 248 3 248 3 248 3 248 2 130 2 130 2 130 2 130 5 962 5 962 5 962 5 962 EBITDAR Scandinavian Airlines + 4,0 p.u. 72,2% 4,2% 18,2% 12,8% 12,4% EBITDAR-marginal Operating lease cost external Braathens + 9,0 p.u. 63,6% -878 -1 050 -932 -2 860 EBITDA -294 - 294 2 198 2 198 1 198 1 198 3 102 3 102 - - 294 294 2 198 2 198 1 198 1 198 3 102 3 102 Spanair + 3,6 p.u. 68,5% � Yields mixed Contr from affiliated -328 -12 3 -337 Depreciation -651 -715 -781 -2 147 Scandinavian Airlines -2% Gain on sales -133 -141 625 351 EBIT -1 406 - - - 1 406 1 406 1 406 1 354 1 354 1 354 1 354 1 041 1 041 1 041 1 041 989 989 989 989 Spanair +26% -40 -291 -405 -736 Net financial items Braathens +/- 0% EBT -1 446 1 039 640 233 - -1 313 - - 1 313 1 313 1 313 1 180 1 180 1 180 1 180 15 15 15 15 -118 - - - 118 118 118 EBT EBT bef gains EBT EBT bef gains bef gains bef gains 7 11/12/2002 8 11/12/2002 SAS Group 2001/2002 EBITDAR – operating performance improved Jan-Sep 2002 vs 2001 � EBITDAR significantly EBITDAR stronger 3 rd Quarter 2002 MSEK MSEK MSEK MSEK MSEK million Jan Jan Jan Jan- -Sep 2002 - - Sep 2002 Sep 2002 Sep 2002 Jan Jan Jan Jan- - - -Sep 2001 Sep 2001 Sep 2001 Sep 2001 compared with 2001 3 500 Revenue 48 235 38 623 � 3 000 EBITDAR 3rd quarter: EBIT 989 27 2 500 � – Positively affected by EBT 233 7 2 000 Braathens of 428 MSEK � 1 500 EBT excl. cap gains -118 -202 – Spanair of 541 MSEK � 1 000 – Widerøe 95 MSEK 500 – Air Botnia 58 MSEK 0 Q1 Q2 Q3 Q4 -500 2001 2002 9 11/12/2002 10 11/12/2002 EBITDAR up 81% 9m SAS Group 2002 – EBT EBITDAR margin up, but CFROI unchanged as capital increase EBT bef gains MSEK 200 MSEK 2002 2 2001 2001 Change Change MSEK 200 MSEK 200 2 2 2001 2001 Change Change MSEK million 1 500 � Revenue 48 235 38 623 25% 1180 1 000 � EBITDAR 5 962 3 290 +81% 500 142 77 15 � EBITDAR 12% 7% +5 p.u. 0 margin -500 -421 � CFROI 13% 13% 0 p.u. -1 000 -1 500 -1313 Q1 Q2 Q3 2001 2002 11 11/12/2002 12 11/12/2002 The SAS Group Investor Relations Tel. +46 (0) 8 797 1451 Fax: +46 (0)8 797 5110 e-mail: investor.relations@sas.se --- Homepage: www.scandinavian.net -- Results Jan -Sep 2002

  3. Revenues driven by acquisitions EBITDAR up 81% in MSEK in MSEK 48 235 + 25% 5 962 +81% 38 623 3 290 2001 2002 2001 2002 EBITDAR Total Revenues 13 11/12/2002 14 11/12/2002 Target to reduce unit costs in Scandinavian Airlines by 20% by 2004 Scandinavian Airlines 15 Lufthansa Group Group Group Group improvement improvement improvement improvement Euro Cents/ASK measures measures measures measures Braathens 10 British Airways Air France Spanair Austrian Airlines Iberia KLM Low Cost Segment 5 600 800 1 000 1 200 1 400 1 600 1 800 2 000 Average Stage Length (Kms) 15 11/12/2002 16 11/12/2002 Structural improvement measures increased The SAS Group’ improvement measures - from 4 000 MSEK to 6 400 MSEK target increased to SEK 12,8 billion Distrubution of Short term measures = MSEK app. 6 400 (2002/03) Short term measures = MSEK app. 6 400 (2002/03) Short term measures = MSEK app. 6 400 (2002/03) Short term measures = MSEK app. 6 400 (2002/03) Short term measures = MSEK app. 6 400 (2002/03) Short term measures = MSEK app. 6 400 (2002/03) Short term measures = MSEK app. 6 400 (2002/03) Short term measures = MSEK app. 6 400 (2002/03) effects (net): 2003: 3 000 MSEK Structural measures = MSEK app. 6 400 (2004/05) Structural measures = MSEK app. 6 400 (2004/05) Structural measures = MSEK app. 6 400 (2004/05) Structural measures = MSEK app. 6 400 (2004/05) Structural measures = MSEK app. 6 400 (2004/05) Structural measures = MSEK app. 6 400 (2004/05) Structural measures = MSEK app. 6 400 (2004/05) Structural measures = MSEK app. 6 400 (2004/05) 6 400 MSEK 2004: 5 500 MSEK 7000 2005: 6 400 MSEK 6000 4 000 MSEK 5000 Target when fully implemented 2004/05 Of which is 4000 revenue effect: Reduce unit costs by 20% in Scandinavian Airlines 3000 2000 Significantly improved cabin factors 2003: 600 MSEK 1000 2004: 1 300 MSEK Enable Scandinavian Airlines to manage lower prices 0 2005: 1 600 MSEK Structural improvements Identified structural improvements November 2002 Increased Spring 2002 identified and identified structural structural measures measures 17 11/12/2002 18 11/12/2002 The SAS Group Investor Relations Tel. +46 (0) 8 797 1451 Fax: +46 (0)8 797 5110 e-mail: investor.relations@sas.se --- Homepage: www.scandinavian.net -- Results Jan -Sep 2002

Download Presentation
Download Policy: The content available on the website is offered to you 'AS IS' for your personal information and use only. It cannot be commercialized, licensed, or distributed on other websites without prior consent from the author. To download a presentation, simply click this link. If you encounter any difficulties during the download process, it's possible that the publisher has removed the file from their server.

Recommend


More recommend