
SLIDE 1
Salehurst & Robertsbridge Neighbourhood Plan
Salehurst & Robertsbridge Neighbourhood Plan Residents Survey - - PowerPoint PPT Presentation
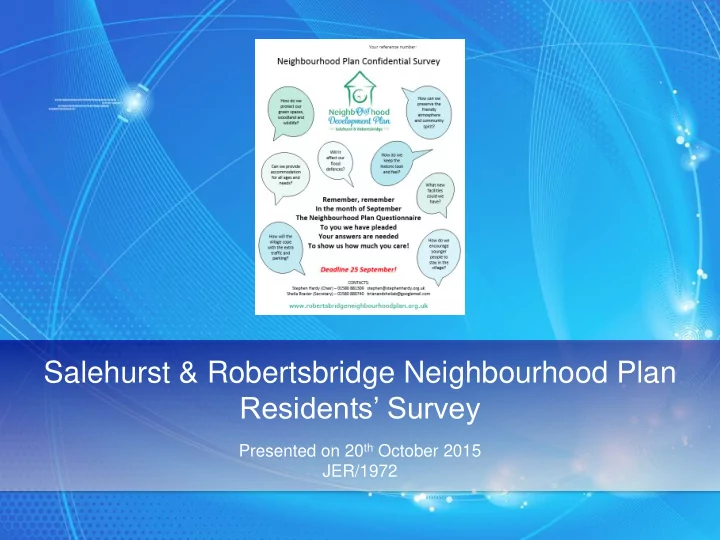
Salehurst & Robertsbridge Neighbourhood Plan Residents Survey Presented on 20 th October 2015 JER/1972 Salehurst & Robertsbridge Neighbourhood Plan 1a. Survey scope Designed to provide community feedback on village plans up to
Salehurst & Robertsbridge Neighbourhood Plan
Salehurst & Robertsbridge Neighbourhood Plan
Salehurst & Robertsbridge Neighbourhood Plan
Please feel free to add any further comments about the plan.
Salehurst & Robertsbridge Neighbourhood Plan
Salehurst & Robertsbridge Neighbourhood Plan
Salehurst & Robertsbridge Neighbourhood Plan
Reproduced by kind permission of Tony Coombes
Salehurst & Robertsbridge Neighbourhood Plan
N.B. 5% = c50 responses Area 2 5% Area 9 22% Area 3 4% Area 5 5% Area 4 9% Area 6 7% Area 7 14% Area 8 7% Area 10 (Darvell) 19% Area 1 8%
Salehurst & Robertsbridge Neighbourhood Plan
Q41, 42 Base: All weighted (963)
* unweighted figures in brackets
Salehurst & Robertsbridge Neighbourhood Plan
Q43, 44 Base: All weighted (963)
Salehurst & Robertsbridge Neighbourhood Plan
54% 14% 23% 1% 1% 5% Working full time Working part time Retired Full time education Unemployed Homemaker
Base: All weighted (963)
68% 31%
Salehurst & Robertsbridge Neighbourhood Plan
Base: All weighted (963)
Salehurst & Robertsbridge Neighbourhood Plan
Salehurst & Robertsbridge Neighbourhood Plan
Base: All weighted (963)
* Figures in brackets exclude Darvell
Salehurst & Robertsbridge Neighbourhood Plan
Base: All weighted (963)
* Mainly area 7 – George Hill, Bishops and Heathfield
Salehurst & Robertsbridge Neighbourhood Plan
Base: All
4 in areas 8 & 9 (Mill Rise/West of level crossing)
All weighted (963)
All excluding Darvell (779)
Salehurst & Robertsbridge Neighbourhood Plan
Salehurst & Robertsbridge Neighbourhood Plan
2% 17% 17% 22% 26% 28% 30% 34% 35% 38%
Base: All weighted (963)
All 20% (26% excl. Darvell)
Salehurst & Robertsbridge Neighbourhood Plan
18% 23% 26% 19% 14% 23% 16% 21% 15% 23%
Base: All weighted (963)
All 20%
Salehurst & Robertsbridge Neighbourhood Plan
N.B. Area bases too low to highlight significant differences
Within S&R 40% (8%)
Base: All planning to move (182) (Figures in brackets based on total sample)
Outside S&R 25% (5%) Don’t know/NA 34% (7%)
Salehurst & Robertsbridge Neighbourhood Plan
27% 33% 50% 34% 44% 28% 19% 33% 25% 34% 31% 20% 54% 30% 23% 32% 26% 50% <45 45-64 65+ H'h of 1 H'h of 2 H'h of 3+ Within S&R Outside S&R Don't know
Base: All planning to move * N.B. Small base size, treat data with caution
(67) (66) (48*) (48*) (48*) (86)
Salehurst & Robertsbridge Neighbourhood Plan
Base: All moving out of S&R (48*) *N.B. Small base size, treat data with caution
Other reasons = 41% Mainly downsizing/age. 7 mentions anti-S&R
Salehurst & Robertsbridge Neighbourhood Plan
All (182) % Detached (71) % Semi (38*) % Terrace (43*) % Detached 36 54 33 37 Semi detached 24 13 30 34 Bungalow 12 12 10 9 Purpose built flat 8 6 8 10 Terrace 7 1 9 8 Converted flat 5 7 2 2 Private retirement home 2 3 3
1 1
1
4 4 2 1
Base: All planning to move in 10 years
Current property
N.B. All other bases too small to analyse * N.B. Small base size, treat data with caution
Salehurst & Robertsbridge Neighbourhood Plan
All (182) % 1 (13*) % 2 (37*) % 3 (62) % 4+ (70) % 1 8 23 8 7 6 2 28 38 34 27 24 3 40 28 54 41 33 4+ 23 10 4 25 35 N/A 1
Average number 3 2.4 2.6 3.1 3.3
Base: All planning to move in 10 years * N.B. Small bases, treat data with caution
Current Bedrooms
Salehurst & Robertsbridge Neighbourhood Plan
Base: All weighted (963)
N.B. Reported need, so treat data with caution Low significant variations ex 30% Area 2 (Andrews, Kemps, Coronation & Rother V)
Salehurst & Robertsbridge Neighbourhood Plan
4% 5% 5% 23% 26% 40% 50% N/A Other Property sizes Jobs Renting cost Property availability Property prices
Base: Those with family wanting to move back (114)
N.B. Reported barriers
Salehurst & Robertsbridge Neighbourhood Plan
Base: Those with family wanting to move back (114)
Private retirement home: 1%, Housing Association retirement home: 1%, N/A: 5%
N.B. Reported needs
Salehurst & Robertsbridge Neighbourhood Plan
Base: Those with family wanting to move back (114)
N/A = 8%
N.B. Reported needs
Salehurst & Robertsbridge Neighbourhood Plan
1% 2% 8% 10% 11% 11% 29% 30% HA retirement home Private retirement home Purpose built flat Converted flat Bungalow Terraced Semi-detached Detached 11% 18% 34% 39% 1 bedroom 4+ bedrooms 2 bedrooms 3 bedrooms
Base: All planning to move/those with family planning to move back (267)
Salehurst & Robertsbridge Neighbourhood Plan
31% 31% 33% 43% 43% 54% 56% Rented HA Shared ownership Private retirement Housing association retirement Energy/water efficient 3 bedroom house 2 bedroom house
(Please tick up to 5 only, out of the following 14 options) Base: All weighted (963) (only 17% Darvell)
Salehurst & Robertsbridge Neighbourhood Plan
4% 1% 11% 15% 16% 18% 29% 30% N/A Caravan/mobile home Self build 4+ bedroom house Care/nursing home 1 bedroom house Flats Bungalows
(Please tick up to 5 only, out of the following 14 options) Base: All weighted (963) (49% Darvell)
Salehurst & Robertsbridge Neighbourhood Plan
Base: All weighted (963)
Salehurst & Robertsbridge Neighbourhood Plan
27% 41% 49% 48% 52% 58% 61% 63% 63% 69% 40% 40% 36% 38% 35% 31% 29% 27% 27% 23% Space for growing food Natural/appropriate local materials Shared green space Soft landscaping Energy efficiency as standard Footpaths linking development to village Feel integrated within community Sympathetic relationship old/new Size to harmonize with existing buildings Look from surrounding countryside High priority Medium priority
Base: All weighted (963)
High/medium priority 92% 90% 90% 90% 89% 87% 86% 84% 81% 67%*
*20% not needed
Salehurst & Robertsbridge Neighbourhood Plan
N.B. Darvell excluded from following analysis as all sites rated acceptable by c100%
45 6 ? 100 17 4 35 ? 35 7 40-50 ? ?
Salehurst & Robertsbridge Neighbourhood Plan
until a site assessment has been done, we’re interested in your views on each of them. Base: All weighted excl. Darvell (779)
40% 45% 52% 77% 29% 24% 23% 12% 22% 20% 16% 5%
Very Quite Not very/not at all
89% 75% 68% 69% +84 +59 +49 +47
cont…
*Permission granted
Number of properties
100 ? 7 17 124
Very/quite Net
Salehurst & Robertsbridge Neighbourhood Plan
until a site assessment has been done, we’re interested in your views on each of them. Base: All weighted excl. Darvell (779)
26% 24% 23% 23% 27% 32% 34% 33% 32% 33% 32% 27%
Very Quite Not very/not at all
56% 57% 56% 52% +29 +25 +23 +20
cont…
…cont
Number of properties
6 ? ? 45
Very/quite Net
Salehurst & Robertsbridge Neighbourhood Plan
until a site assessment has been done, we’re interested in your views on each of them. Base: All weighted excl. Darvell (779)
16% 18% 16% 18% 23% 21% 21% 28% 24% 24% 52% 50% 46% 43% 43%
Very Quite Not very/not at all
47% 42% 44% 39% 37% +4
…cont
Very/quite Net
35 ? 40-50 35 4
Number of properties
Salehurst & Robertsbridge Neighbourhood Plan
Net scores Number of properties Site 3 Mill Site 100 Site 3a Adj Mill Site ? Site 8 Countrycrafts 7 Site 12 Adj. Culverwells 17
Total excl. Darvell +84 +59 +49 +47
83 46 43 53
81 50 37 41
71
72 68
73 57 45 37
73 55 46 39
97 72 50 45
89 74 53 52
86 66 66 42
87 68 43 45
N.B. Northbridge Street more extreme scores
Salehurst & Robertsbridge Neighbourhood Plan
Salehurst & Robertsbridge Neighbourhood Plan
(87% Darvell)
Base: All weighted (963)
Salehurst & Robertsbridge Neighbourhood Plan
Base: All users – weighted (919) Average number days per week = 3 N.B. Frequency higher:
Frequency lowest:
Salehurst & Robertsbridge Neighbourhood Plan
Non users (27*) % Non/less often users (182) % Not enough choice of products 25 22 Pricing 22 10 Parking 16 22 Other 37 32* NA 14 22
* N.B. Small base size, treat data with caution
+ Mainly lack of transport, convenience, order in
Salehurst & Robertsbridge Neighbourhood Plan
Base: All weighted (963)
Salehurst & Robertsbridge Neighbourhood Plan
foreseeable future. Please tick your preferred sit for the relocation of each of these surgeries? Base: All weighted (963)
1% / 1%
Purple = Doctor Green = Dentist
*% / 1%
45% / 43%
3% / 4%
3% / 3%
1% / 2%
3% / 3%
5% / 6%
15% / 11%
1% / 1%
* = less than 1%
16% / 14%
1% / *
* / 1%
Salehurst & Robertsbridge Neighbourhood Plan
8% 10% 17% 18% 29% 22% 29% 25% 34% 53% 29% 32% 30% 39% 32% 39% 41% 44% 42% 31% 44% 39% 30% 29% 30% 26% 18% 14% 12% 8% 18% 21% 24% 14% 9% 12% 12% 16% 12% 7%
Local museum Skate park Community woodland for use as fuel source Off-road cycling track Swimming pool Gym/health club Venue for arts/community activies Improved recreation facilities Multiuse court Improved/extended footpaths, bridleways, cycle paths
High priority Medium priority Not needed DK/NA
Base: All weighted (963) Net High/medium priority
84% 76% 69% 70% 61% 61% 57% 47% 42% 37% 76% 64% 55% 52% 35% 31% 28% 17% 3%
Salehurst & Robertsbridge Neighbourhood Plan
All (963) % <45 (260) % 45 – 64 (339) % 65+ (345) %
Improved & extended footpaths, bridleways etc 76 78 79 71 Multiuse court 64 68 62 60 Improved recreation facilities 55 67 52 43 Venue for arts/community activities 52 49 54 53 Gym/health club 35 53 35 15 Swimming pool 31 41 28 19 Off-road cycling track 28 28 32 24 Community woodland for use a fuel source 17 24 22 2 Skate park 3
12
Local museum
Base: All weighted
Salehurst & Robertsbridge Neighbourhood Plan
Salehurst & Robertsbridge Neighbourhood Plan
Base: All weighted (963) Range by area 54% (2. Andrews, etc) to 80+% (8. Mill Rise, 4 Northbridge St, 6, Station Rd)
Salehurst & Robertsbridge Neighbourhood Plan
Base: All weighted (963) (43% excl. Darvell) (95% Darvell)
Salehurst & Robertsbridge Neighbourhood Plan
14% 20% 16% 23% 39% 48% 56% 42% 14% 26% 32% 31% 30% 25% 18% 40% 60% 37% 34% 18% 21% 20% 13% 5% 12% 17% 17% 27% 10% 7% 13% 12% Introducing one-way system in High St Widening pavements in busy areas eg outside Belle Flowers Resurfacing the roads with anti- skid surface Moving loading bay outside Seven Stars Creating new pavements in Station Rd 20mph speed limit Yellow lines at top of Station Rd (opp. Judges) Restoring and repairing brick pavements in High St High priority Medium priority Not needed DK/NA High/medium priority 82% 74% 73% 69% 54% 48% 46% 28%
measures in your view? Base: All weighted (963)
Salehurst & Robertsbridge Neighbourhood Plan
Restoring pavements in High St Yellow lines Station Rd 20mph speed limit New pavements Station Rd
All 77 61 53 48
70 51 38
86 69 26 16
87 52 41 41
89 62 84 58
83 46 61 62
97 73 63 62
79 60 60 40
83 81 65 66
77 62 41 39
59 58 52 72
measures in your view? Base: All weighted (963)
Salehurst & Robertsbridge Neighbourhood Plan
High priority Medium priority Not needed DK/NA
developing/improving services? Base: All weighted (963)
Net High/medium priority
Salehurst & Robertsbridge Neighbourhood Plan
Salehurst & Robertsbridge Neighbourhood Plan
High priority Medium priority Not needed DK/NA
Base: All weighted (963)
Net High/medium priority
Salehurst & Robertsbridge Neighbourhood Plan
Base: All weighted (963)
Flat across subgroups
Salehurst & Robertsbridge Neighbourhood Plan
35% 35% 41% 43% 54% 54% 56% 43% 43% 42% 40% 33% 33% 32% 8% 8% 8% 7% 13% 13% 9% 10% 9% 10% 7% Replacement of heating systems Equipping buildings with green energy sources Upgrading all lighting to LED bulbs Harnessing rain water Draft-proofing doors and windows Improving insulation of walls/floors/roof spaces Converting street lighting to low energy + time control
High priority Medium priority Not needed DK/NA
important you feel each of the following to be? Base: All weighted (963)
Net Diff. High/medium priority
88% 87% 87% 83% 83% 78% 78% 84% 84% 83% 76% 75% 70% 70%
Salehurst & Robertsbridge Neighbourhood Plan
Salehurst & Robertsbridge Neighbourhood Plan
54% 14% 23% 1% 1% 5% Working full time Working part time Retired Full time education Unemployed Homemaker
Base: All weighted (963)
68% 31%
Salehurst & Robertsbridge Neighbourhood Plan
Base: All working (578)
Salehurst & Robertsbridge Neighbourhood Plan
97% 77% 73% 68% 67% 64% 59% 57% 49% 44%
Salehurst village & outlying Andrews/Kemps/Coronation & Rother V Northbridge St, Rutley Close High St, everything off it Fair Lane, Fayre Meadow Everything else west
Station Rd, Willowbank et al George Hill, Bishops & Heathfled Mill Rise Darvell
Base: All working (578)
Ave: 68%
Salehurst & Robertsbridge Neighbourhood Plan
Base: All working *Inflated by Darvell + Main ‘other premises’: Education, outdoors/farming, medical, various
+
Salehurst & Robertsbridge Neighbourhood Plan
Base: All working
NB: some multi-coding
Salehurst & Robertsbridge Neighbourhood Plan
Base: All working 1 = Salehurst village and outlying 2 = Andrews/Kemps/Coronation & Rother V 3 = Northbridge St, Rutley Close 4 = High St, everything off it 5 = Fair Lane, Fayre Meadow 6 = Station Rd, Willowbank et al 7 = George Hill, Bishops & Heathfield 8 = Mill Rise 9 = Everything else west of level crossing 10 = Darvell
10 1 3 4 2 7 9 6 5 8
Total: 36% (ex Darvell)
Salehurst & Robertsbridge Neighbourhood Plan
6% 18% 26% 49% <5 miles 5 - 10 miles 10 - 20 miles Over 20 miles
Base: All working
Salehurst & Robertsbridge Neighbourhood Plan
All (578) % S&R (322) %
(129) % Beyond (181) %
Base: All working
Salehurst & Robertsbridge Neighbourhood Plan
Base: All working (578)
Salehurst & Robertsbridge Neighbourhood Plan
Base: All planning to move premises within 10 years (33*)
*NB: Small base size, treat data with caution
Salehurst & Robertsbridge Neighbourhood Plan
Base: All working (578)
Salehurst & Robertsbridge Neighbourhood Plan
Within S&R 42% East Sussex 4% Beyond 16%
Base: All planning to move or start up (57*)
Don’t know 32%
NB: Small base size, treat data with caution
Salehurst & Robertsbridge Neighbourhood Plan
*NB Low base size, treat data wit h caution
Salehurst & Robertsbridge Neighbourhood Plan
Salehurst & Robertsbridge Neighbourhood Plan
Salehurst & Robertsbridge Neighbourhood Plan
Mill Site (100 homes)
Countrycrafts (7 homes)
Salehurst & Robertsbridge Neighbourhood Plan
Salehurst & Robertsbridge Neighbourhood Plan
Salehurst & Robertsbridge Neighbourhood Plan
Linda Jones & Partners 1 Station Road Woodbridge Suffolk IP12 4AU 01394 383944 / 388756 01394 610485 research@ljandp.co.uk t f e