Sacramento Regional Water Bank The region has already seen success - - PowerPoint PPT Presentation
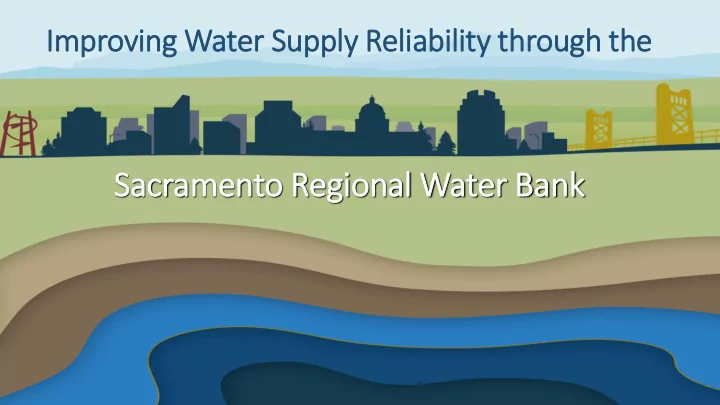
Im Improving Water Supply Reliability through the Sacramento Regional Water Bank The region has already seen success from conjunctive use North American Subbasin South American Subbasin Despite this success, we cant ignore longer -term
The region has already seen success from conjunctive use
North American Subbasin South American Subbasin
Despite this success, we can’t ignore longer-term changes in hydrology In fact, SGMA compels us to take the long view
100,000 150,000 200,000 250,000 300,000 350,000 400,000 450,000 500,000 550,000 600,000 650,000 700,000 750,000 800,000 850,000 900,000 950,000 1,000,000 Oct 1 Nov 1 Dec 1 Jan 1 Feb 1 Mar 1 Apr 1 May 1 Jun 1 Jul 1 Aug 1 Sep 1
Folsom Lake Reservoir Level (acre-feet) Water Year (WY) (October 1 - September 30)
Folsom Lake Storage Levels
Historical Average Recent Average (WY 2001 - Current)
Total Reservoir Capacity: 977,000 acre-feet
It seems that we have plenty of conjunctive use potential
Still have plenty of existing groundwater use to offset
2,000 4,000 6,000 8,000 10,000 12,000 14,000 16,000 18,000 20,000
Jan Feb Mar Apr May Jun Jul Aug Sep Oct Nov Dec
In excess of 1.8 million AF available storage space
Conjunctive use analysis was performed for agencies overlying the groundwater basin and contiguous with each other
Two fundamental questions
1. What we can do today by reoperating existing system? 2. What we can do over next 10 years with new facilities added to system?
Constraints Considered:
- Whether or not systems fluoridate
- Water rights/contracts
- Surface water treatment plant capacity
- Conveyance/intertie capacity
- Groundwater production capacity
- Operational issues identified by purveyors
Constraint Not Considered:
- Cost of water
Area 1 Area 2 Area 4 Area 3
Recharge Potential Recovery Potential
31% 69%
Actual (2011-13 Average)
Surface Water Groundwater
86% 14%
Potential (2011-13 Average)
Surface Water Groundwater
36% 64%
Actual (2015)
Surface Water Groundwater
42% 58%
Potential (2015)
Surface Water Groundwater
We have conjunctive use potential, but we still lack incentive to act further
Opportunities Barriers
- For existing system, reoperations
cost differential is in excess of $300 per acre-foot
- For new facilities, capital costs
estimated at about $288 million
(Wet Year) (Dry Year)
With Existing System With Near- Term New Facilities
Developing a Water Bank can help incentivize expanding conjunctive use and ensure future sustainability
- Multi-year storage (“long-term market”) of
Central Valley Project contract water for internal
- r external partners
- Storage before recovery
- Loss factor over length of storage
- Monitoring and mitigation
- Single year transfers (“spot market”) by
using groundwater in place of an existing surface water right
- Storage before recovery not required
- One-time loss factor at time of transfer
- Monitoring and mitigation
Following groundwater banking guidelines can help ensure success under SGMA
A 2018 pilot proved our ability to work together and understand many of the mechanisms of a Water Bank
- 40
- 35
- 30
- 25
- 20
- 15
- 10
- 5
5 10 Sep-17 Nov-17 Jan-18 Mar-18 May-18 Jul-18 Sep-18 Nov-18 Jan-19 Mar-19 May-19 Jul-19 Sep-19 Nov-19
MW - Chuckwagon
Transfer Period
60 Production Wells 20 Monitoring Wells
The 2018 pilot showed the positive results of agencies working together
Agency July through September Totals in Acre-feet
Baseline Groundwater Use Total Pumped Transfer Credited*
City of Sacramento 2,426 4,491 2,313 SSWD 3,074 8,077 4,602 CWD 1,001 1,390 358 CHWD 130 1,584 1,338 FOWD 393 1,989 1,469 Totals 7,024 17,981 10,080 *Includes 8% streamflow depletion
The path to the Water Bank and its expansion
- 2022
- ~ $2 million
Finish planning to become fully
- perational
- ~2030
- ~$288 million
- Expansion scalable as funds available
Build additional facilities to expand
- n operations
A Water Bank can start small and grow substantially through time
North American Subbasin South American Subbasin Municipal in-lieu Municipal direct Recycled in-lieu Flood-MAR Agricultural in-lieu
Sources of recharge
T i m e