
SLIDE 1
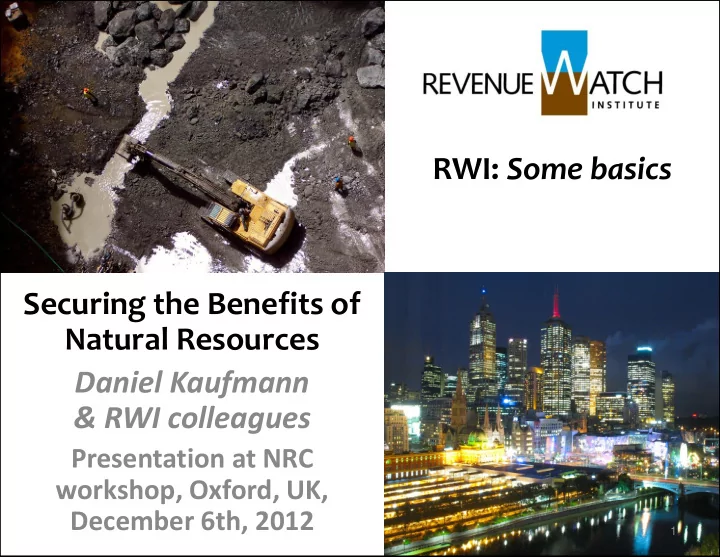
RWI: Some basics Securing the Benefits of Natural Resources Daniel Kaufmann & RWI colleagues
Presentation at NRC workshop, Oxford, UK, December 6th, 2012
1
RWI: Some basics Securing the Benefits of Natural Resources Daniel - - PowerPoint PPT Presentation
RWI: Some basics Securing the Benefits of Natural Resources Daniel Kaufmann & RWI colleagues Presentation at NRC workshop, Oxford, UK, December 6th, 2012 1 Basics on RWI in natural resource governance Why are we in this? What do
Presentation at NRC workshop, Oxford, UK, December 6th, 2012
1
2
Longstanding central question:
management outcomes?
the latter (#2): resource curse not foregone conclusion
exacerbates governance problems when they exist
3
0.0 0.2 0.4 0.6 0.8 1.0 2002 2003 2004 2005 2006 2007 2008 2009 2010 2011 WGI Control of Corruption, 2011 Extractive Countries with satisfactory Governance Non-Extractive Intensive Countries Extractive-Intensive Countries (All)
Control of Corruption in:
Trends in Governance among Extractive and Non-Extractive Intensive Countries, 2002-2011: Control of Corruption
Source: Worldwide Governance Indicators, 2012. The extractive countries with satisfactory control of corruption trend line (atop) includes a dozen countries. 4
GDP per Capita in Extractive-Intensive & Other Countries, by Control of Corruption Tercile Groups, WGI 2011
Sources: Corruption Control data from Worldwide Governance Indicators (WGI), 2012. IMF 2010 Report on Resource-Intensive
control of corruption score for the sample of all countries in the world.
Poor Corruption Control Average Corruption Control Good Corruption Control GDP per capita (PPP), 2011
EXTRACTIVE OTHER
33.3% 11.1%
5,000 10,000
55.6% 25.6% 33.5% 40.5% 6,851 3,941 12,712 10,272 45,222 30,820
Note: The percentages inserted in each dark blue column represent the % of all extractives that belong to each control of corruption tercile (poor, average, good). Similarly, for light blue columns, the % of all other countries in each control of corruption category.
5
challenges in oil, gas and minerals.
governance and development of natural resources
and national and international oil, gas and mining companies
Central Asia. Offices in each region.
Azerbaijan, Bolivia, Indonesia, Iraq, Ghana, Guinea, Liberia, Libya, Peru, Sierra Leone, Tanzania, Uganda
building to various stakeholders, and performs policy analysis.
6
Getting a good deal Revenue collection Revenue management Sustainable development
mining companies
per capita GDP
YET
population below poverty line
7
WHICH AREAS SHOULD BE TRANSPARENT?
The basis for any decision to permit exploitation of a mineral deposit should be set out clearly in published laws and regulations Contract terms, including fiscal terms should be made public Financial information on revenues into the public domain will facilitate enforcement and reduce tax avoidance Disclosure of
financial data
stabilization and investment funds The disposition
revenues should be fully transparent
Government Assistance
drafting and policy reform to contract modeling and negotiation support.
Indonesia, Iraq, Liberia, Libya, Mongolia, Nigeria, Peru, Philippines, Sierra Leone, Tanzania, Timor Leste and Uganda Getting a Better Deal.
share of revenues from major mining projects. Institutional Arrangements, Transparency and Accountability.
Managing Volatile Resource Revenues.
system, helping country mobilize additional revenue for domestic investment + promoting transparency standards & protections vs over-spending.
9
DO GOVERNMENTS GET A GOOD DEAL?
0% 10% 20% 30% 40% 50% 60% 70% 80% 90% N
w a y T i m
L e s t e N i g e r i a E q u a t
i a l G u i n e a Y e m e n C a m e r
C
g
a b
A z e r b a i j a n K a z a k h s t a n M a u r i t a n i a I v
y C
s t
Average Government share from oil producers
10
countries rich in oil, gas and minerals.
has regional hubs in partnership with academic institutions to
University, Duke University and the Central European University, RWI is also developing a training program for government officials from resource rich countries.
America, 1 in Central Asia); 6 in 2013 (Asia and MENA)
11
Evidence-based Advocacy
coalitions to participate in the multi-stakeholder processes such as EITI Analytical Work
analysis of revenue data from EITI reports.
common set of quality indicators, for cross-country comparison of revenue data.
economies from Ghana to Iran, Liberia, Nigeria and Russia.
12
1. Multi-stakeholder, collective action approach: working more in tandem with gov’ts, civil society, parliaments, media, private sector 2. Partnerships with organizations in natural resource governance field: NRC, SPP/CEU, EITI, PWYP, GW, Industry groups, OGP, Oxfam, ONE, IFIs, etc. 3. NRC as a potent diagnostic tool in our work: further integration? 4. From rigorous analysis to concrete action and policy-making: evidence- based -- including development of databank, indices 5. Multi-pronged & integrated products: capacity building, T.A., local NGO grants, operational research, policy analysis & advocacy 6. Expanding scope of work within the natural resource value chain + deeper
13