SLIDE 1
RS Update Assessment: MRIP Concerns
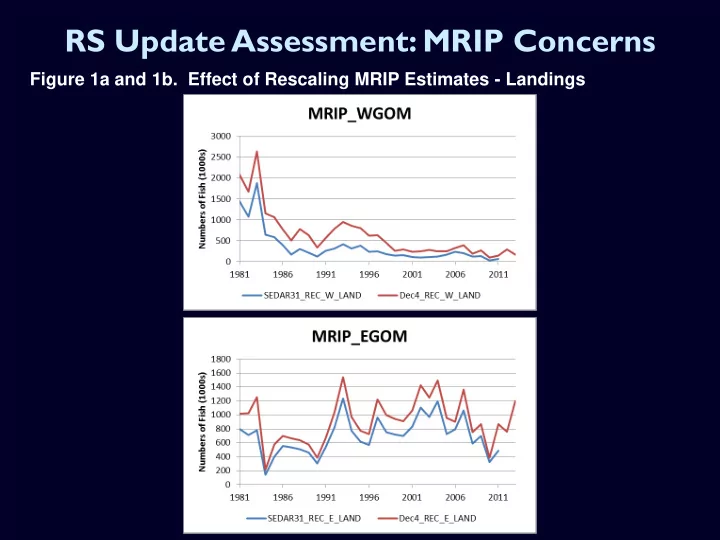
Figure 1a and 1b. Effect of Rescaling MRIP Estimates - Landings
SLIDE 2
RS Update Assessment: MRIP Concerns
Figure 2a and 2b. Effect of Rescaling MRIP Estimates - Discards
SLIDE 3
RS Update Assessment: F and B Trends
SLIDE 4
Red Snapper Update Assessment
The SSC moves that the red snapper update base assessment model is the best scientific information available and is acceptable for management purposes. The stock is estimated to remain overfished, but is not undergoing overfishing. Motion passed 14-0, with one abstention.
SLIDE 5
RS Update Assessment: Projections
SLIDE 6
RS Update Assessment: OFL/ABC
Both the OFL and ABC motions passed unanimously. Year OFL Yield at FSPR26% Yield at FRebuild ABC P* = 0.427 and FRebuild PDF 2015 14.73 13.22 13.00 2016 14.56 13.40 13.21 2017 14.40 13.51 13.32
SLIDE 7
Alternative MSY Proxies for Red Snapper
SLIDE 8
Alternative RS MSY Proxies: Issues Raised
Is there truly no relationship between SSB and recruitment? What does fixing steepness really imply? Working from the Council’s current MSY proxy as a null, can the SSC offer scientific guidance for a change? Effect of changing rebuilding schedules on ABC/ACL?
SLIDE 9
Region-specific RS Population Trends
SLIDE 10
Reconsideration of Gag OFL/ABC
SLIDE 11
Reconsideration of Gag OFL/ABC Chagaris (2015) Objective: To estimate the mortality rate of gag grouper caused by red tides from 2002-2014
Spatial extent and duration – satellite imagery Severity – cell concentration samples Species distribution patterns – ecosystem model Mortality – logistic response function
SLIDE 12 Reconsideration of Gag OFL/ABC
EwE
Satellite imagery (extent, duration) In situ cell concentrations (severity) Red tide map (cells/Liter) Species distribution map Logistic response function applied in each map cell Parameters estimated to fit 2005 Mrt and then applied to
Chagaris (2015)
SLIDE 13
Reconsideration of Gag OFL/ABC
2014 Mrt = 0.018 – 0.035 y-1 4-7% of mortality caused in 2005
SLIDE 14
Reconsideration of Gag OFL/ABC
The SSC recommends that the OFL for gag grouper in the Gulf of Mexico be set at 0% of the 2005 red tide mortality event. 2015 - 6.77 mp gw 2016 - 5.84 mp gw 2017 - 5.38 mp gw Motion passed 14-2.
SLIDE 15
Reconsideration of Gag OFL/ABC
The SSC recommends that the ABC for gag grouper in the Gulf of Mexico be set at the OY level from model projections assuming 0 red tide mortality. 2015 - 5.21 mp gw 2016 - 4.75 mp gw 2017 - 4.57 mp gw Motion passed unanimously.
SLIDE 16 Greater Amberjack Rebuilding
The SSC moves that the greater amberjack projections provided by the SEFSC are sufficient to inform management actions by the Gulf
- Council. Options 1-4 among landing scenarios each are projected
to rebuild the greater amberjack stock by 2020. Motion passed unanimously.
SLIDE 17
Gulf KM Assessment: Winter Mixing Zone
SLIDE 18 Gulf KM Benchmark Assessment
The SSC moves that the SEDAR 38 king mackerel base assessment model is the best scientific information available and is acceptable for management purposes. The stock is estimated not to be overfished
- r undergoing overfishing.
Motion passed 11-1.
SLIDE 19
Gulf King Mackerel OFL
The SSC moves that the OFL for king mackerel in the Gulf of Mexico be set as the yield stream at FSPR30%. 2015 - 10.11 mp ww 2016 - 9.61 mp ww 2017 - 9.27 mp ww 2018 - 9.11 mp ww 2019 - 8.95 mp ww Motion passed unanimously.
SLIDE 20
The SSC moves that the ABC for king mackerel in the Gulf of Mexico be set at P* 0.43 applied to the OFL PDF. 2015 - 9.62 mp ww 2016 - 9.21 mp ww 2017 - 8.88 mp ww 2018 - 8.71 mp ww 2019 - 8.55 mp ww Motion passed unanimously.
Gulf King Mackerel ABC