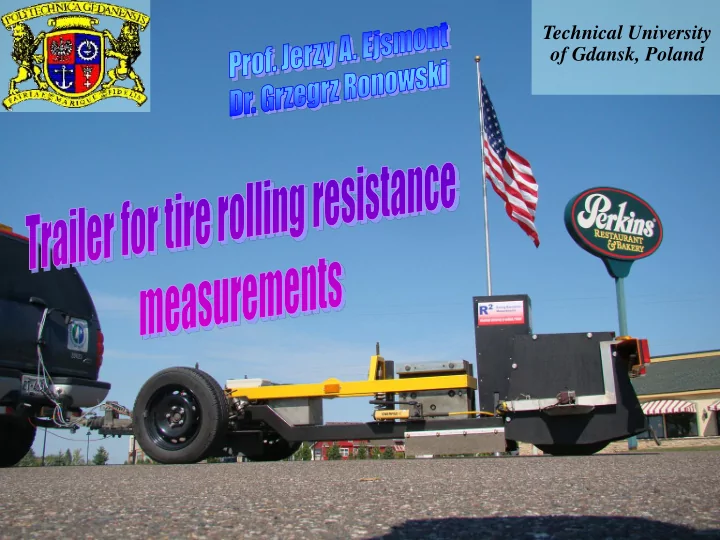

Technical University of Gdansk, Poland
Rolling Resistance Influence on Fuel Consumption Decrease of tires Rolling Resistance by 10% results in approximately 3% reduction of fuel consumption Number of vehicles in Poland - 15 000 000, in USA – 250 000 000 Use of tires with 10% less Rolling Resistance would reduce daily fuel consumption by approximately 1000 tons (USA - 35 000 tons) Daily savings in CO 2 emission would amount to 3000 tons (USA – 100 000 tons) [Silka W.: Energochłonność ruchu samochodu, Warszawa, WKŁ 1997]
Resistance forces acting on typical passenger car 100% 90% Air drag 80% Rolling resistance 70% Inertia forces 60% 50% 40% 30% 20% 10% 0% ECE cycle 90 km/h 120 km/h [Silka W.: Energochłonność ruchu samochodu, Warszawa, WKŁ 1997]
Rolling Resistance
Rolling Resistance
Rolling Resistance
Road Methods of Rolling Resistance Evaluation Towing (car or trailer) Coast-down Torque measurements Fuel consumption
Laboratory Methods of Rolling Resistance Evaluation Measurement of: * Spindle force * Torque of the power system * Coast-down time
Laboratory Methods of Rolling Resistance Evaluation
Errors in Rolling Resistance Estimations (misalignments / grade) W 200 N L 3800 N r 0 . 3 m a e f 0 . 01 r L a F R W L cos( ) 0 y r a F R L sin( ) 0 W r e r R e R r y Rr F f m Ry L W a 00 ' f 0 . 0100 m a 30 ' f 0 . 0187 m a 04 ' f 0 . 0110 m a 20 " f 0 . 0101 m
Errors in Rolling Resistance Estimations (acceleration) W 200 N L 3800 N r 0 . 3 m m 20 kg m 1 . 4 * m 28 kg I e L a f 0 . 01 F I r r R W L 0 W y e F R I 0 r Rr I m a Ry F f m L W 2 a 0 . 0 m / s f 0 . 0100 m 2 a 0 . 1 m / s f 0 . 0107 m
Errors in Rolling Resistance Estimations (air drag) W 200 N L 3800 N r 0 . 3 m B 200 mm V m 20 kg e L f 0 . 01 r A F r R W L 0 y W e F R A 0 r 2 v Rr A c B 2 r x 2 Ry F f m L W v 0 m / s f 0 . 0100 m a 20 m / s f 0 . 0172 m
Errors in Rolling Resistance Estimations (acceleration) Generally, equipment constructed for Traction measurements is not appropriate for Rolling Resistance measurements as the Traction and Rolling Resistance forces are of different magnitude. Usually Rolling Resistance force is at about 100 times less than maximal possible Traction force.
Belgian Trailer for Rolling Resistance Measurements
Principle of Operation Kierunek jazdy f t = W t /Z 5 6 3 8 9 7 2 LOAD Ciężar W t P f 4 1 Z 1 -frame; 2 -loading system; 3 -axis of frame and loading device; 4 -measuring arm; 5 -test wheel; 6 -adjustable load; 7 -damper and spring
Polish Trailer Mk.1
Polish Trailer Mk.1 rama przyczepy FRAME wahacz pomiarowy ARM
Polish Trailer Mk.2
Polish trailer Mk. 3
Calibration x l A’ A B P 6 θ a b α 7 W t 1 8 C C 2 9 3 4 5
Examples of the results Nawierzchnia odcinka pomiarowego Test section P1 S5 P2 S3 S2 S1 S4 Warto ść współczynnika 0,0106 0,0116 0,0117 0,0118 0,0135 0,0140 0,0159 RR coefficient
Recommend
More recommend