RIVERWALK DEVELOPMENT 1-million square foot new entertainment, - - PowerPoint PPT Presentation

riverwalk development
SMART_READER_LITE
LIVE PREVIEW

RIVERWALK DEVELOPMENT 1-million square foot new entertainment, - - PowerPoint PPT Presentation

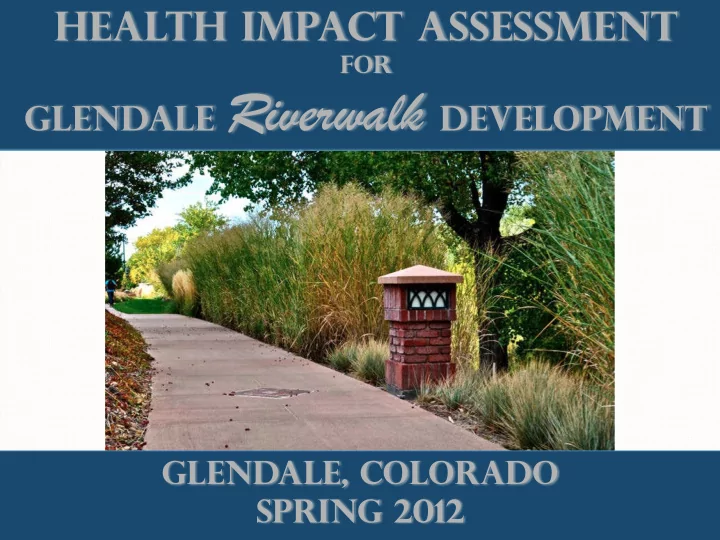
Health Impact Assessment FOR Glendale Riverwalk Development Glendale, Colorado Spring 2012 RIVERWALK DEVELOPMENT 1-million square foot new entertainment, retail, restaurant district proposed just east of CO Blvd and north of Cherry Creek


slide-1
SLIDE 1

Health Impact Assessment

FOR

Glendale Riverwalk Development

Glendale, Colorado Spring 2012

slide-2
SLIDE 2

RIVERWALK DEVELOPMENT

1-million square foot new entertainment, retail, restaurant district proposed just east of CO Blvd and north of Cherry Creek

slide-3
SLIDE 3

PARTNERS & CONTRIBUTORS:

slide-4
SLIDE 4

Health is the state of a person’s:

– Physical – Mental – Social well-being It is not just the absence of disease or infirmity.

HEALTH

Source: World Health Organization

slide-5
SLIDE 5

2 0 0 0

Obesity Trends* Am ong U.S. Adults BRFSS, 1 9 9 0 , 2 0 0 0 , 2 0 1 0

( * BMI ≥3 0 , or about 3 0 lbs. overw eight for 5 ’4 ” person) 2 0 1 0 1 9 9 0 No Data <10% 10%–14% 15%–19% 20%–24% 25%–29% ≥30%

slide-6
SLIDE 6

Increasing Health Concerns with Obesity:

  • Chronic Disease
  • Type II diabetes
  • High Blood Pressure
  • High Cholesterol
  • Cardiovascular Disease

HEALTH

slide-7
SLIDE 7

HEALTH

According to the World Health Organization, health status is determined by a range of factors. The factors listed in the

  • uter three semicircles are known as the “environmental and social determinants of health” and are generally

considered to be the root determinants of health and disease.

slide-8
SLIDE 8

WHY assess the built environment?

The Built Environment is Policy in Concrete:

Source: Richard J Jackson MD, Designing Healthy Communities: Uniting the Missions and Perspectives of Public Health and Urban Planning Webinar, October 12, 2011

slide-9
SLIDE 9

Definition of Health Impact Assessment

A combination of procedures, methods and tools that systematically judges the potential, and sometimes unintended, effects of a policy, plan, program or project on the health of a population and the distribution of those effects within the

  • population. HIA identifies appropriate actions to

manage those effects.

International Association for Impact Assessment, 2006

DEFINITION

slide-10
SLIDE 10

INTRODUCTION HIA PROCESS

Determines the need and appropriateness of HIA Determines which health issues to evaluate, evidence basis for these impacts, methods for analysis, and a workplan Provides: 1) A profile of existing health conditions 2) Evaluation of potential health impacts Recommendations Development of the HIA report and the communication of findings and recommendations Tracks the impacts of new policy/plan/project on populations in the community

slide-11
SLIDE 11
  • Increase transparency in the policy decision-making process
  • Support community engagement in the decision-making process
  • Serve vulnerable populations who typically may not have a ‘seat at the table’
  • Shift decision-making from an economic to an overall quality of life framework
  • Identify the trade-offs involved with a project or policy

WHY HIA?

slide-12
SLIDE 12

1969 National Environmental Policy Act (NEPA) requires study of environmental & health effects; emphasis was environment 1980s World Health Organization encourages Health Promotion/Healthy Public Policy in 1986 Ottawa Charter 1990s

  • England recommends analysis of impacts of policy on health inequities
  • WHO publishes Gothenburg Consensus Paper on HIA
  • First HIA in U.S. (San Francisco Living Wage policy)

2000s

  • World Bank requires HIA of all large projects
  • HIA on proposed Alaska North Slope Oil Lease

2010s

  • HIA used around the world
  • More common in U.S. (about 100 completed)
  • HIA Practice Standards Released

A Brief History of HIA

HISTORY of HIA

slide-13
SLIDE 13

HIAs ACROSS THE COUNTY

slide-14
SLIDE 14

HIAs ACROSS COLORADO

slide-15
SLIDE 15
  • Assess possible impacts on, and recommendations for, active

transit in Glendale as it relates to the new Glendale Riverwalk.

  • Create healthier options to access Glendale’s Riverwalk.
  • Increase physical activity among residents and workers.
  • Utilize the location of the Riverwalk to make enhancements

throughout the community.

  • Develop a useful guide for future improvements.

OBJECTIVES OF GLENDALE HIA

slide-16
SLIDE 16

PARTNERS & CONTRIBUTORS:

slide-17
SLIDE 17

GLENDALE, CO

slide-18
SLIDE 18

GLENDALE, CO

slide-19
SLIDE 19

RIVERWALK DEVELOPMENT

New development will add year-round activities to Glendale, and bring about significant changes in walkability, bikeability, access to public transportation, vehicular traffic, access and connectivity, and economic development opportunities.

slide-20
SLIDE 20

SCOPING: ACTIVE TRANSIT

Scoping Pathway Diagram: Selected Health Determinants: 1. Automobile Traffic 2. Access and connectivity 3. Personal Safety 4. Walkability 5. Bikeability 6. Public Transit

slide-21
SLIDE 21

SCOPING

Important to conduct a literature review to determine the evidence base that supports the recommendations

slide-22
SLIDE 22

ASSESSMENT: Various data sources

slide-23
SLIDE 23

Population: 4,184 Size: 0.6 square miles Households: 2,630 Renters: 92% Median Income: $32,500 Families in Poverty: 24.2% Median Age: 27.7

DEMOGRAPHICS

slide-24
SLIDE 24

Certain demographic groups face significant barriers to getting enough physical activity.

  • Seniors

– 4.2% of Glendale Population; Growing

  • Children

– 18% of population

  • Low Income Population

– 24% of Families in Glendale are below the Poverty line

  • Minorities

– 31% of Glendale residents are foreign born – 16 different languages spoken in Glendale

  • People with Disabilities

– 17% of Glendale Residents are disabled – 64% of Glendale Seniors are disabled

AT RISK POPULATIONS

slide-25
SLIDE 25

PRELIMINARY FINDINGS

ECONOMIC DEVELOPMENT

PERSONAL SAFETY TRAFFIC WALKABILITY BICYCLING TRANSIT ACCESS

slide-26
SLIDE 26

WALKABILITY

Walkable Communities:

  • Have pedestrian amenities
  • Have connected, direct routes
  • Have a variety of destinations
  • Provide access to convenient transit
slide-27
SLIDE 27

WALKABILITY

Key Findings: 84% of streets have attached sidewalks

  • Detached sidewalks are more pleasant

42% of Glendale Streets have both residential and non-residential uses Only 7% of streets have on-street parking

  • Provides a buffer for pedestrians

50% of streets have shaded walking areas

  • Shade=protection from UV rays
slide-28
SLIDE 28

WALKABILITY

Recommendations:

  • Create buffers between sidewalk

and street ways

  • Add missing sidewalk segments
  • Add on street parking
  • Encourage way-finding with

signs, maps, and landscape cues to direct pedestrians

Wayfinding Sidewalk Buffers

slide-29
SLIDE 29

BICYCLING

KEY FINDINGS

  • No marked bike lanes, sharrows or route

indicators in Glendale

  • About 2% bike to work
  • Community feed back indicated conflicts
  • n Cherry Creek path
slide-30
SLIDE 30

Recommendations:

  • Place bike lanes and sharrows on

key streets

  • Provide bike facilities at the

Riverwalk and throughout Glendale

  • Separate bicycle and pedestrian

users along the Cherry Creek Trail

BICYCLING

slide-31
SLIDE 31

TRANSIT

Key Findings:

  • 17% of Glendale residents do not

have a car

  • 11% of residents commute via

transit

  • All residents live within ¼ mile of

bus stop

  • Only 4% of Glendale residents

work in Glendale

Distance reachable in 29 minutes on public transit:

slide-32
SLIDE 32

TRANSIT

Recommendations:

  • Prioritize infrastructure improvements near transit stops
  • Improve the safety and attractiveness of bus stops
  • Provide informational signage/kiosks near transit stops
  • Incentivize employers to subsidize employees who commute to work via

mass transit, bicycle or foot

  • Work with RTD to improve bus service to employment centers
slide-33
SLIDE 33

ACCESS

Key Findings:

  • Large surface parking lots inhibit

connectivity

  • Avg. block length is 620 feet

(desired is 300-400)

  • More than 1/3 of street

segments missing a portion of sidewalk

  • Poorly placed/sized sidewalks
slide-34
SLIDE 34

ACCESS

Recommendations:

  • Complete sidewalk network, grid

pattern

  • Create bicycle/pedestrian corridor

between Riverwalk & Infinity Park

  • Provide pedestrian and bicycle

pathways through parking lots

  • Fill in surface lots with new

development

  • Improve connectivity with Cherry

Creek Bike Path

slide-35
SLIDE 35

TRAFFIC

Key Findings:

  • Average street width is 55 feet – ideal is around 28 feet (excepting

high traffic volume streets)

  • Wider streets result in increased vehicle speed
  • Top challenge to walking and biking in the survey was traffic

volume/speed

slide-36
SLIDE 36

TRAFFIC

Automobile Collisions Automobile Collisions with Pedestrians or Bicyclists

slide-37
SLIDE 37

TRAFFIC

Benefits of Roundabouts

slide-38
SLIDE 38

ECONOMIC BENEFITS

Walkable and bikeable communities can lead to…

  • More retail activity and

increased sales tax revenues – particularly for small businesses

  • Reductions in property

vacancies

  • Higher property values
slide-39
SLIDE 39
  • Obtain public comment on HIA draft report
  • Share findings
  • Implement recommendations:

– During planning & design – After construction – When undertaking other planning efforts

  • Monitor post-development
  • Enjoy a happier, healthier Glendale

NEXT STEPS FOR GLENDALE HIA

slide-40
SLIDE 40
  • Partners and collaboration are crucial
  • Data collection challenges (cost, timeframe, local level)
  • Strive for better multi-cultural community engagement

LESSONS LEARNED

slide-41
SLIDE 41
  • Build collaboration between planning & public health agencies
  • Build awareness about connection between health and land use among elected
  • fficials, general public, planners, community groups
  • White House Task Force on Childhood Obesity Report to the President:

“Communities should be encouraged to consider the impacts of built environment policies and regulations on human health”

  • State and federal level efforts to incorporate HIA into regulatory process
  • Calls from the OCCUPY movement to improve the lives of the vast majority of

Americans experiencing economic insecurity reinforces the commitment to improving health and reducing health disparities.

OUTLOOK & FUTURE OF HIAs

slide-42
SLIDE 42
slide-43
SLIDE 43

Thank you to our Partners and Contributors