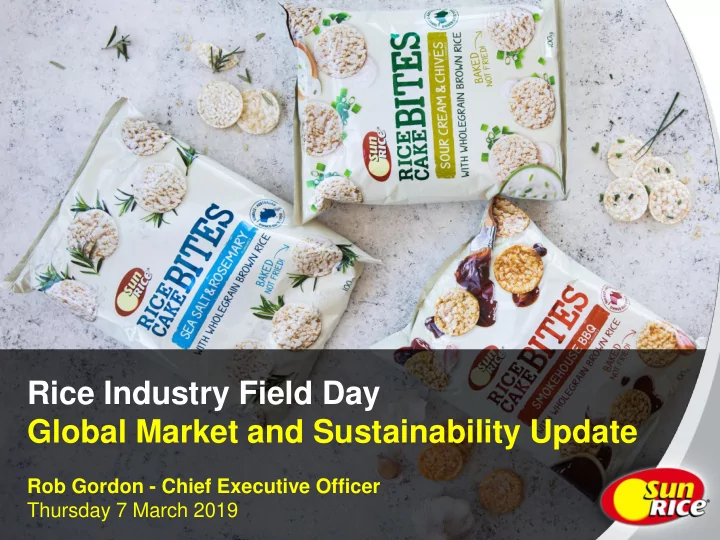

Rice Industry Field Day Global Market and Sustainability Update Rob Gordon - Chief Executive Officer Thursday 7 March 2019
Global Outlook • Global Market • California Developments • Global Stockpiles • Foreign Exchange Sustainability Update 2
Medium Grain Prices: Tender Markets US$/tonne (FOB Origin Port) Japan Minimum Access Pricing (Since 2007) 1,300 Period since last Field Day 1,200 1,100 1,000 900 800 700 600 500 400 Source: Creed Report 3
California Annual Plantings '000 acres California Rice Acres Planted 595 600 585 567 561 560 550 562 558 541 Forecast Range 534 533 500-530 526 528 520 506 519 509 480 473 4 … 440 445 Long term aveage of CA plantings has been lowered (to ~500,000 acres) 429 due to competition from increased permanament plantings 400 Source: SunRice and USDA 4
California: Conditions for our Major Competitor While it is still early in the cycle, there is presently ample water in California and 2019 plantings are expected to be in the range between 500,000-530,000 acres The years of +540,000 acres of rice plantings are unlikely given the expansion of almond plantations and permanent cropping Californian medium and short grain exports forecast to be 35% higher than last year - Coming off smallest export volume since 2014/15, and weaker crops in Australia and Egypt - Increased exports likely to be focused on Middle East and North Africa Japanese tender prices have also remained buoyant, having recently returned above US$800/tonne 5
Global Stockpiles still High Rice Stockpiles: China / Thailand / Egypt + 'Rest of World' Million tonnes 180 China Thailand Egpyt Rest of the World 160 140 120 100 80 60 40 20 0 Source: USDA 6
Chinese Stockpiles and Exports Increase As a result of high floor prices for domestic farmers, China stockpiles have increased by around 6% to 116 million tonnes, which accounts for 69% of overall global stockpiles China continues to increase exports, especially into lower returning markets such as Asia and the Pacific, to unwind stockpiles China’s annual rice exports have increased by 75% since early 2017 and now - exceed 2 million tonnes - SunRice is taking advantage of this opportunity and has agreed to purchase Chinese medium grain rice - In Middle Eastern sensory testing Chinese medium grain has performed well - Will US-China trade talks impact trade flows? Egypt has unwound stockpiles by 59% over the past year and levels are now at lowest since 2014 due to small domestic crop and import requirements Despite country-specific variances, global rice trade volumes have experienced minimal change, as reflected in strong pricing year-on-year Premium Riverina rice is sold into high returning markets, as rice sourced beyond Australia satisfies demand in lower returning markets 7
Foreign Exchange Movements – A$/US$ A$/US$ (since January 2015) 0.85 Weaker A$/US$ exchange rate is favourable for international rice sales 0.80 SunRice’s rice price is sensitive to exchange rate fluctuations 0.75 US central bank commentary suggests US rates are presently in neutral position 0.70 Majority of our banking syndicate are Period since 2018 Field Day Average heding for FY19 is US$0.75 presently forecasting A$ to depreciate 0.65 over 2019 PNG bond issuance in September 2018 PNG Kina/US$ (since January 2015) has improved USD liquidity, reducing 0.40 SunRice’s exposure to the depreciating 0.38 PNG Kina exchange rate 0.36 0.34 Period since 2018 Field Day 0.32 0.30 0.28 8 Sources: Bloomberg
Is the A$ Set for Further Depreciation? US Ten Year Yield 10 Year Rate Spread - Aus v US (Since 2012) AUD/USD 3.0 1.10 1.05 2.5 1.00 2.0 We flagged that SunRice anticipated the 0.95 depreciation of the AUD at the 2018 Field Day 1.5 0.90 1.0 0.85 0.80 0.5 0.75 0.0 0.70 -0.5 0.65 10 Year Bond Spread AUD v USD AUD/USD -1.0 0.60 Source: Bloomberg 9
Iron Ore Pricing versus AUD/USD Iron Ore Price US$ Iron Ore Price versus AUD/USD AUD/USD 180 1.10 1.05 160 1.00 140 Movements since 2018 Field Day 0.95 120 0.90 100 0.85 80 0.80 60 0.75 40 0.70 20 0.65 Iron Ore AUD/USD 0 0.60 Source: Bloomberg 10
Crop Size and Milling Yield Crop Size and Average MG Milling Yield Milling Yield (%) '000 tonnes Crop Size ('000 tonnes) - LHS Milling Yield 1,200 60 59.3% 58.5% 57.2% 57.4% 1,000 55 54.9% 800 55.4% 51.5% 600 50 48.3% 400 45 1,161 200 800 963 625 829 802 690 244 50 0 40 Source: SunRice 11
Pricing Indicators: On Balance Remain Positive World Rice Prices Foreign Exchange Milling Yields Crop Size Branded Markets & Sale of Premium Varieties Ensure Stronger Pricing 12
SunRice Provides Reliable Paddy Price Indicators SunRice continues to provide growers with Crop Size and Paddy Price (since CY11) A$/tonne reliable price range 450 indicators and guidance C18 Range $415 $385-410 $405 $395 400 Regular adjustments to $379 price range guidance are 350 communicated to growers $317 depending on market and 300 trading conditions $294 250 $255 Base of the C18 paddy price range has increased 200 by $30/tonne over the past six months: now $385-410/tonne Source: SunRice 13
Sustainability – A local and global responsibility 14
Sustainability is a Key Focus – Why? Companies that focus on sustainability and anchor sustainability within the strategies and activities of their businesses, create a competitive advantage for their business, while working towards addressing social, environmental and ethical issues. 15
Sustainability is a Key Focus – Why? China is an example of a market where the consumer is demanding sustainable and safe food: increasing portion of regular spending (~87%) is on food rather than non-food products Characteristics of food deemed most important by consumers in China Scale: 1 5 4.9 4.8 4.5 4.4 4.3 3.9 3.5 Source: KPMG According to IRRI, consumers are willing to pay between 30-35% premium for rice that can demonstrate traceable and sustainable credentials 16
Sustainable Rice Platform (SRP) 17
Questions 18
Recommend
More recommend