
SLIDE 1
1
RESULTS PRESENTATION
Half year ended 31 December 2017
21 February 2018
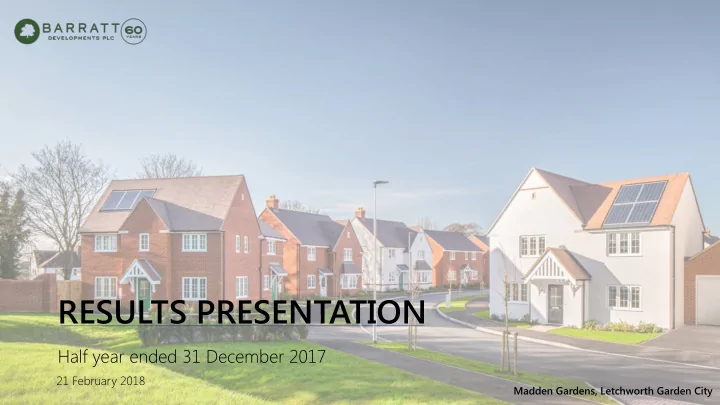
Madden Gardens, Letchworth Garden City
RESULTS PRESENTATION Half year ended 31 December 2017 21 February - - PowerPoint PPT Presentation
RESULTS PRESENTATION Half year ended 31 December 2017 21 February 2018 Madden Gardens, Letchworth Garden City 1 Weaver View, Winsford David Thomas Chief Executive 2 SUMMARY Strong financial and operational performance in the first half
1
Half year ended 31 December 2017
21 February 2018
Madden Gardens, Letchworth Garden City
2
Weaver View, Winsford
3
Strong financial and operational performance in the first half
SUMMARY
Operational improvements delivering margin benefits Robust market fundamentals Disciplined volume growth with a focus on addressing supply-side challenges Delivering attractive cash returns Confidence in the business going forward
4
FY18 FY19 FY20 FY21 FY22
New Barratt housetypes New David Wilson housetypes Increased use of standard product Strategic land Five year warranty Show home lease back
IMPROVING KEY FINANCIAL METRICS – DRIVING OPERATING MARGIN Achieved H1 17/18: 17.9%, +260bps since FY15
Full P&L impact Zero P&L impact
5
Saxon Gate, Stamford Bridge
6
STRONG SALES PERFORMANCE
Average net private reservations per active outlet per week
H1 17/18 H1 16/17 Change
Regional 0.67 67 0.66 1.5% London 0.86 86 1.20 (28.3%) Group 0.68 68 0.68
1.08 08 1.27 (15.0%)
7
weighted to the second half
COMPLETION GROWTH
Completions
H1 17/18 H1 16/17 Change
Regional 6,782 782 6,630 2.3% London 162 152 6.6% Group 6,94 944 6,782 2.4% JV 380 80(1) 398 (4.5%)
(1) Includes 225 completions in London (H1 16/17: 215)
8
COMPLETIONS ANALYSIS – BUYER TYPE
H1 17/18 H1 16/17
36% 36% 35% 35% 33% 33% 32% 32% 18% 18% 18% 18% 9% 9% 9% 9% 4% 4% 6% 6%
Help to Buy Other private Affordable Part exchange Investor
9
some underlying house price inflation
PRICING TRENDS REMAIN POSITIVE
Private completions average selling price (£’000) H1 17/18 H1 16/17 Change Regional 301. 1.7 286.0 5.5% London 793. 3.6 725.2 9.4% Group 314.6 296.4 6.1% JV 615. 5.7 621.7 (1.0%)
10
LAND MARKET
HOLDING PICTURE – CB SPEAKING TO PHIL BARNES
20 40 60 80 100 120 140 1997 2002 2007 2012 2017 Savills UK Residential Development Land Index (100 = 2007 peak) Greenfield land House prices
Savills UK Residential Land Index(1)
(1) UK non-urban, greenfield land vs UK house prices (rebased)
11
LAND APPROVALS
12 months to to Dec 17 12 months to to Dec 16 Chang nge Site tes 118 118 115 2.6% Plot
26,498 498 18,682 41.8% Avera erage ge plots
r site te 225 25 162 38.9% Media ian plots ts per site te 148 138 7.2% Lad adden en Gar arden en Villa lage, e, North th Yate te, , Avon
with excellent local amenities on the doorstep Northsto towe we, , Longsta tanton, , South th Camb mbrid idges eshir ire
Cambridgeshire area and support our new division Chape apel l Park, k, Oldmeldr meldrum, , North Scotla tland
with all amenities locally
12
94% 94% 6% 6% Regional London
LAND BANK – NATIONAL COVERAGE
97% 97% 3% 3% up to £600k £600k+
(1) Private owned and controlled land bank plots excluding JVs as at 31 December 2017 (2) Private owned land bank plots excluding JVs, in England only with selling price under £600k Note: 31 December 2016: Regional: 93%, London: 7%, up to £600k: 94%, £600k+: 6%
regional business
(1)
(2)
13
91% 1% 8% Zones 3+ Zone 2 Zone 1
LAND BANK – LONDON(1)
81% 14% 5% up to £600k £600k to £1m £1m+
(1) Private owned and controlled land bank plots excluding JVs as at 31 December 2017 Note: 31 December 2016: Zone 3+: 83%, Zone 2: 7%, Zone 1: 10%; up to £600k: 69%, £600k-£1m: 23%, £1m+: 8%
now in Zones 3+
land bank is below £1m
14
DRIVING OPERATING MARGIN - STRATEGIC LAND
H1 17/18 FY17 H1 16/17 Completions from strategic land 28% 28% 25% 24% Acres held 11,8 ,806 06 11,737 11,405 Number of locations 266 266 267 270
argeting 30% of completions from strategic land in the medium term
(1)
(1) On strategic land approved since 2009 versus ongoing land
15
contractors
132
157
20 40 60 80 100 120 140 160 180
51 81
10 20 30 40 50 60 70 80 90
DRIVING OPERATING MARGIN – PRODUCT
+19%
Identified for new Barratt range ge Buildi ding g new Barratt range ge
Number of new sites
+59%
(1) All includes: Barratt Homes and David Wilson main and Scottish ranges
16
CUSTOMER FIRST- WE PLACE CUSTOMERS AT THE HEART OF EVERYTHING WE DO
Internal processes
Customer journey Site management Quality assurance ‘Great Places’ design standards
External measures
HBF Customer Satisfaction survey NHBC Pride in the Job Awards National Supreme Awards NHBC quality checks
First time buyers Wayne Lamb and Kelly McNab purchased a house at The Spinnings, Preston
17
CUSTOMER FIRST- OUR ACHIEVEMENTS
Steve Wood, CEO NHBC with h Henry Patecki cki, , winner of the 2017 NHBC Natio iona nal l Supreme Award in the Large Buil ilder category
HBF 5 star customer recommendation award – eighth consecutive year 74 NHBC Pride in the Job Awards – more than any housebuilder for 13th year
18
MANAGING THE COST ENVIRONMENT
e.g. timber, insulation
Build costs expected to increase by c. 3-4% in FY18 Similar levels expected in FY19 Materials Labour
manufacturing
19
STRONG PERFORMANCE
Northwalls Grange, Taunton
20
Lauder Gardens, Strathaven
21
KEY HIGHLIGHTS
£m (unless otherwise stated)
H1 17/18 H1 16/17 Change
Revenue
1,988.0 988.0 1,816.2 9.5%
Adjusted gross profit (1)
413.2 3.2 375.2 10.1%
Adjusted gross margin (1)
20.8% .8% 20.7% 0.1ppts
Operating profit
355.2 5.2 324.0 9.6%
Operating margin
17.9% 9% 17.8% 0.1ppts
PBT
342.7 2.7 321.0 6.8%
Earnings per share
27.1p 1p 25.9p 4.6%
Net cash
165.9 5.9 196.7 (15.7%)
ROCE
28.3% 3% 27.0% 1.3ppts
(1) Gross profit £410.2m (H1 16/17: £375.2m), gross margin 20.6% (H1 16/17: 20.7%)
22
REVENUE SUMMARY
£m (unless otherwise stated)
H1 17/18 H1 16/17 Change
Completions Private
5,715 15 5,561 2.8%
Affordable
1,229 229 1,221 0.7%
Total completions
6,94 944 6,782 2.4%
% Affordable
18% 18% 18%
380 380 398 (4.5%)
Total completions (inc JV’s)
7,324 24 7,180 2.0%
ASP (£’000) Private
314.6 4.6 296.4 6.1%
Affordable
124.7 4.7 115.3 8.2%
Total
281.0 1.0 263.8 6.5%
JV
494.4 4.4 528.8 (6.5%)
23
OPERATING MARGIN BRIDGE
15.0% 15.5% 16.0% 16.5% 17.0% 17.5% 18.0% 18.5% 19.0% 19.5% 20.0% H1 16/17 Regional legacy & traded out sites Regional new sites starting trading, mix &
Zones 1 & 2 London trading Admin Commercial including adjusted item H1 17/18
Increase Decrease
24
BALANCE SHEET
£m
31 December 2017 31 December 2016
Goodwill and intangible assets 892 92.2 892.2 Investment in joint ventures and associates 228 28.3 254.6 Gross land bank 3,229. 229.0 2,801.3 Land creditors (1,18 185. 5.4) 4) (961.6) Net land bank 2,043 043.6 1,839.7 Land creditor % 36.7% 7% 34.3% WIP 1,704. 04.4 1,673.8 Net cash 165. 5.9 196.7 Trade payables (328 28.2) (324.6) Other working capital (391 91.4) (434.5) Other net assets / liabilities (47.1) 1) (87.6) Net assets 4,267. 67.7 4,010.3
25
LAND BANK
Land bank plots 31 Dec 2017 31 Dec 2016 Owned 64,542 542 52,976 Controlled 19,075 075 24,120 Total 83,617 17 77,096 Land bank years 5.0 5.0 4.9 JV – Owned and controlled 5,329 329 4,911 Total including JV 88,946 46 82,007
21.7% 20.4% 20.9% 20.7% 20.4% 19.7% 18.9% 18.0% 18.3% 17% 18% 19% 20% 21% 22% Dec-13 Dec-14 Dec-15 Dec-16 Dec-17 Plot cost as % of ASP in land bank
(1) Calculated as average land bank value per plot in the balance sheet at half or year end divided by ASP at current prices on owned plots in the land bank (1)
26
WORK IN PROGRESS
Unsold stock units per active outlet 1.1 1.1 1.2 10,000 12,000 14,000 16,000 18,000 0.0 0.4 0.8 1.2 1.6 2.0 Dec-15 Dec-16 Dec-17
Units £bn
WIP Wholly owned completions
reflects
active sites
expected to deliver over the next 2 years
appropriate
(1) Wholly owned completions 12 months to December
(1)
27
LEGACY ASSET REDUCTION
£m (unless otherwise stated) 31 December 2017 Legacy Ongoing Gross land bank 3,229 29.0 .0 78.9 3,150.1 Land creditors (1,1 ,185 85.4) .4) (18.3) (1,167.1) WIP 1,704.4 4.4 94.6 1,609.8 Other assets and liabilities (491.3 .3) (65.1) (426.2) Capital employed 3,256 56.7 .7 90.1 3,166.6 ROCE (%) 28.3% 3% 22.9% 28.5% Gross margin (%)(2) 20.8% 8% 10.3% 21.5% 200 400 600 800 1,000 Jun-14 Dec-14 Jun-15 Dec-15 Jun-16 Dec-16 Jun-17 Dec-17
Legacy assets (£m)
(1) Does not include liabilities (2) Pre adjusted item. Gross margin is 20.6% post adjusted item (1)
28
CASH FLOW
(600) (500) (400) (300) (200) (100) 100 200 300 400 Profit from
Net cash interest & tax Other non- cash and working capital WIP / PX Land Land creditors JV investment Operating cash outflow Dividends Other investing & financing Net cash
£m
Inflow Outflow
29
GEARING
0% 5% 10% 15% 20% 25% 30% 35% 40% 45% 50% Dec-13 Dec-14 Dec-15 Dec-16 Dec-17 Net debt/cash and land creditors as % of tangible net assets
neutral over full year
land and the increased dividend payment
30
GUIDANCE FOR FY18
Completions
Modest growth in wholly owned completions
ASP
Similar ASP to H1 17/18
Total admin expenses
JV share of profits
Interest cost
(£15m cash, £35m non-cash)
Land cash spend
Land creditors
30% to 35% of owned land bank
Year end net cash
Ordinary dividend
2.5x cover
Special dividend
£175m
31
Belle Vue, Doncaster
32
KEY DIFFERENTIATORS Disciplined growth Improving key financial metrics Attractive cash returns
Experienced build and sales teams Strong balance sheet and cash generation Industry leading quality and service standards Shorter owned land bank National housebuilder
33
MARKET FUNDAMENTALS REMAIN ATTRACTIVE Demand continues to exceed supply Strong Government support Positive lending environment Attractive land market 1.64%
average 2 year fixed rate at 85% LTV(1) Government target: 300k homes per annum
(1) Source: Bank of England monthly interest rate of UK monetary financial institutions at January 2018
Need new picture
34 10% 20% 30% 40% 50% 60% 70% 1983 1991 2000 2008 2017 Mortgage costs as proportion of earnings Halifax affordability Average
POSITIVE LENDING ENVIRONMENT
1.4% 1.9% 2.4% 2.9% 3.4% 3.9% Jan-14 Jan-15 Jan-16 Jan-17 Jan-18 Mortgage rate Standard 85% product Help to Buy (Equity Loan)
(1) Rates are from an average of five lenders. Standard 85% product based on available rate with a fee not exceeding £1,000. HtB product based on the best available HtB equity share rate with no fee. Rates as at 30 January 2018 (2) The mortgage to earnings ratio is calculated using the Halifax standardised average house price (seasonally adjusted), average disposable earnings for all full time employees and the BoE monthly average rate for new advances to households
Average mortgage rates(1) Halifax Mortgage Affordability Index(2)
35
ADDRESSING MARKET CHALLENGES
Quality and Service Skills shortages Alternative methods of construction
36
nationally
alent Development programme award at the 2017 Training Journal Awards
Construction Degree(1)
DISCIPLINED GROWTH – SELF HELP AND SUPPORTING THE WIDER INDUSTRY
New apprentices Joe Rowley, Helen Ward Thorpe, Dan Edwards and Ryan McNally
(1) Launched in conjunction with Sheffield Hallam University in 2013
37
DISCIPLINED GROWTH – ALTERNATIVE METHODS OF CONSTRUCTION
Offsite concrete garage trial in Nottingham
38
DISCIPLINED GROWTH – QUANTITY
the last six financial years
ambitions
changing our existing structure
Land approved at Northstowe, South Cambridgeshire
39
50 100 150 200 250 300 350 400 450 500 FY15 FY16 FY17 FY18 FY19
£m Dividends paid in respect of:
Ordinary Special
ATTRACTIVE CASH RETURNS Total: £1.87bn
(1)(2) (1) Based on Reuters consensus estimates of earnings per share of 64.7p for FY18 and 68.0p for FY19 as at 15 February 2018 and applying a two and a half times dividend cover in line with the announced policy, 31 December 2017 share capital of 1,011,532,123, for proposed payments (2) Proposed FY18 and FY19 dividends subject to shareholder approval
Capital Return Plan
be returned to shareholders in the form of special dividends:
(1)(2)
40
CURRENT TRADING – SALES PERFORMANCE
Net private reservations per active outlet per average week
H2 17/18 to date H2 16/17 to date Change
Regional 0.80 80 0.76 5.3% London 1.36 36 1.13 20.4% Group 0.82 82 0.77 6.5%
full year
41
CURRENT TRADING – FORWARD ORDER BOOK
H2 17/18 (as at 18 Feb 18) H2 16/17 (as at 19 Feb 17) Change £m £m Plot
£m £m Plot
£m £m Plot
Private 1,965.7 5,852 1,945.8 5,579 1.0% 4.9% Affordable 857.4 6,588 769.8 6,187 11.4% 6.5% Whol
ly owned ed 2,823. 823.1 12,440 40 2,715 15.6 11,76 766 4.0% 5.7% JV 254.8 845 302.6 965 (15.8)% (12.4)% Total tal 3,077 077.9 13,285 285 3,01 018.2 12,731 731 2.0% 0% 4.4%
42
OPERATING FRAMEWORK
Land bank
Land creditors 30% to 35% of owned land bank
Treasury
Year end net cash
Capital Return Plan
2.5x ordinary dividend cover Special dividend programme
43
POSITIVE ON OUTLOOK
Pembroke Park, Cirencester
44
Kingsbrook, Aylesbury
45
APPENDICES - INDEX
Page Definitions 46 P&L 47 Balance sheet - land bank 48 Land creditors - payment profile 49 Completions - product type 50 London land prices 51 Investment in joint ventures and associates 52 Joint venture land bank plots 53 Net interest charge analysis 54 Financing arrangements 55
46
DEFINITIONS
average number of ordinary shares in issue during the year, excluding those held by the Employee Benefit Trust
months to December
foreign exchange swaps
pension scheme and operating adjusting or exceptional items, divided by average net assets adjusted for goodwill and intangibles, tax, cash, loans and borrowings, retirement benefit assets/obligations and derivative financial instruments
47
P&L
£m (unless otherwise stated) H1 17/18 H1 16/17 Change Revenue 1,98 988.0 8.0 1,816.2 9.5% Cost of sales (1,57 577.8 .8) (1,441.0) (9.5%) Gross profit 410.2 .2 375.2 9.3% Gross margin 20.6% 6% 20.7% (0.1ppts) Administrative expenses (55.0 .0) (51.2) (7.4%) Operating profit 355.2 .2 324.0 9.6% Operating margin 17.9% 17.8% 0.1ppts Net finance costs (23.2 .2) (29.4) 21.1% Share of JV/assoc profit 10.7 .7 26.4 (59.5%) PBT 342.7 .7 321.0 6.8%
48
BALANCE SHEET – LAND BANK
Land bank plots 31 December r 2017 31 December r 2016 Owned / unconditional contracts 64,54 542 52,976 Conditional contracts 19,0 ,075 24,120 Total land bank plots 83,61 617 77,096 JV plots – owned / conditional 5,329 29 4,911 Total land bank plots (including JV’s) 88,94 946 82,007 Land bank pricing (£’000) Cost of plots acquired 53.0 39.3 Cost of plots in P&L 52.6 50.9 Cost of plots in balance sheet 48.7 50.5 Owned land bank ASP 266 266 267
49
LAND CREDITORS - PAYMENT PROFILE
100 200 200 300 300 40 400 500 500 600 600 700 800 800 900 900 1,0 ,000 00 1,1 ,100 00
31- 1-Dec Dec-17 17 H2 17/ 17/18 18 FY19 FY20 FY21 & beyond
1,185 85.4 .4 332.3 .3 381.7 .7 209.7 .7 261.7 .7 £m £m
50
COMPLETIONS ANALYSIS – PRODUCT TYPE
H1 17/18 H1 16/17
14% 14% 13% 13% 2% 2% 2% 2% 10% 10% 12% 12% 35% 35% 34% 34% 34% 34% 34% 34% 5% 5% 5% 5%
Flats s (non (non-Lon
don) Flats s (Lo (Londo don) 1 & 2 & 2 Bed 3 Bed 4 Bed 5 & 6 & 6 Bed
51
LONDON LAND PRICES
20 40 60 80 100 120 140 160 1997 1999 2001 2003 2005 2007 2009 2011 2013 2015 2017 Savills UK Residential Development Land Index (100 = 2007 peak) London land House prices - London (rebased)
52
INVESTMENT IN JOINT VENTURES AND ASSOCIATES
31 December ber 201 017 31 December ber 201 016 £m £m £m £m Housebuilding London 198.0 193.8 Non-London 28.4 36.0 Total housebuilding 226.4 229.8 Other Commercial 1.9 2.1 Equity share joint venture
Associates
Total tal 228 28.3 .3 254.6 4.6
53
JOINT VENTURE LAND BANK PLOTS
(1) Zone 1: 393 (2016: 606), Zone 2: 196 (2016: 203), Zone 3+: 3,242 (2016: 2,291)
31 December ber 201 017 31 December ber 201 016 plot
plot
London - owned 3,099 1,757 London - controlled 732 1,343 London total 3,831(1) 3,100(1) Regional - owned 1,418 1,731 Regional - controlled 80 80 Regional - total 1,498 1,811 Total tal 5,329 329 4,911 11
54
NET INTEREST CHARGE ANALYSIS
£m £m
H1 17/18 18 H1 16/17 /17 Interest on term debt and overdrafts (0.5) 1.7 Interest on private placement notes 2.6 2.0 Utilisation / non-utilisation fees on RCF’s 1.9 2.1 Swap interest
Other interest 0.7 2.4 Total tal cash h inte teres est 4.7 11.6 Land creditors / deferred payables 17.7 16.5 Financing fees 1.1 1.5 Pension (0.3) (0.2) Total tal non-ca cash inte teres est 18.5 17.8 Total tal inte teres est 23.2 29.4
55
FINANCING ARRANGEMENTS
Loan Facility Amount Maturity Interest basis RCF facilities £700m
(1)
December 2022 LIBOR +1.25%
(2)
Private placement notes £200m August 2027 2.77% Get Britain Building £16.8m March 2018 EU ref rate +1%
(1) Amend and Extend completed in December 2016 to remove the £150m step-down and extend the RCF. In December 2017, the Group exercised the option to extend the RCF by a further year to December 2022. (2) Does not include utilisation and non-utilisation fees, based on margin applied at 30 June 2017
56
DISCLAIMER
This document has been prepared by Barratt Developments PLC (the “Company”) solely for use at a presentation in connection with the Company‘s Interim Results Announcement in respect of the half year ended 31 December 2017. For the purposes of this notice, the presentation (the “Presentation”) shall mean and include these slides, the oral presentation of the slides by the Company, the question-and-answer session that follows that oral presentation, hard copies of this document and any materials distributed at, or in connection with, that presentation. The Presentation does not constitute or form part of and should not be construed as, an offer to sell or issue, or the solicitation of an offer to buy or acquire, securities of the Company in any jurisdiction or an inducement to enter into investment activity. No part of this Presentation, nor the fact of its distribution, should form the basis of, or be relied on in connection with, any contract or commitment or investment decision whatsoever. Statements in this Presentation, including those regarding the possible or assumed future or other performance of the Company or its industry or other trend projections may constitute forward-looking statements. By their nature, forward-looking statements involve known and unknown risks, uncertainties and other factors which may cause actual results, performance
prove to have been correct. They speak only as at the date of this Presentation and the Company undertakes no obligation to update these forward-looking statements. The information and opinions contained in this Presentation do not purport to be comprehensive, are provided as at the date of the Presentation and are subject to change without