
SLIDE 1
1
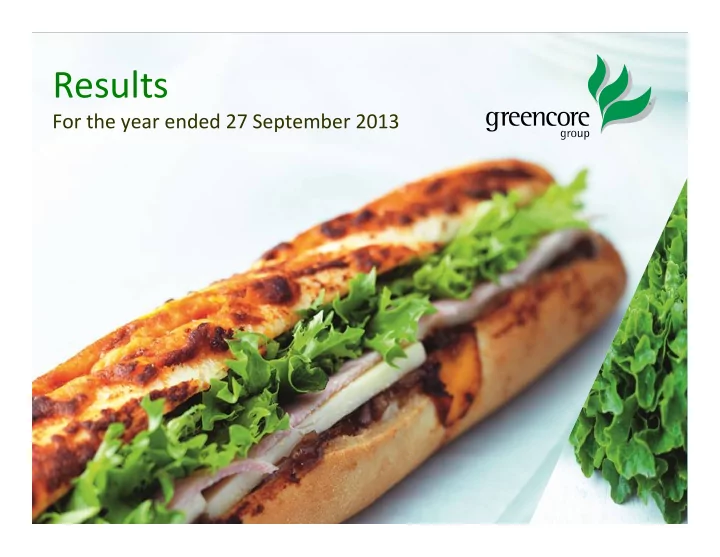
Results
For the year ended 27 September 2013
Results For the year ended 27 September 2013 1 AGENDA Highlights - - PowerPoint PPT Presentation
Results For the year ended 27 September 2013 1 AGENDA Highlights Patrick Coveney, CEO Financial Review Alan Williams, CFO Operating & Strategic Review Patrick Coveney, CEO Outlook Patrick Coveney, CEO Q&A Open to the Floor 2
1
For the year ended 27 September 2013
2
AGENDA
Open to the Floor Q&A Patrick Coveney, CEO Outlook Patrick Coveney, CEO Operating & Strategic Review Alan Williams, CFO Financial Review Patrick Coveney, CEO Highlights
3
HIGHLIGHTS
‐ STRONG DELIVERY
1.Resilient performance 2.Strategic progress 3.Building momentum
Alan Williams Chief Financial Officer
5
FINANCIAL SUMMARY
£1,197.1m £1,197.1m
Revenue Revenue
+3.0% +3.0% 14.5p 14.5p
Adjusted earnings per share2 Adjusted earnings per share2
+13.3% +13.3%
FY13 Versus FY12
£76.5m £76.5m
Operating profit1 Operating profit1
+8.1% +8.1% 6.4% 6.4%
Operating margin1 Operating margin1
+30 bps +30 bps
1.
Operating profit and margin are stated before exceptional items and acquisition related amortisation
2.
Adjusted profit before tax and adjusted earnings measures are stated before exceptional items, pension finance items, acquisition related amortisation, FX on inter‐company and certain external balances and the movement in the fair value of all derivative financial instruments and related debt adjustments
£61.6m £61.6m
Adjusted PBT2 Adjusted PBT2
+11.8% +11.8% 4.8p 4.8p
Dividend per share Dividend per share
+12.9% +12.9% £232.8m £232.8m
Net debt Net debt
‐£25.2m ‐£25.2m 12.9% 12.9%
ROIC ROIC
+100 bps +100 bps
6
CONVENIENCE FOODS
+7.0% 69.1 73.9 Operating profit1 +20 bps 6.3% 6.5% Operating margin1 +3.5% 1,091.1 1,129.2 Revenue % change FY12 £m FY13 £m
0.2% ‐ lower market growth than PY and exacerbated by horsemeat scandal
acquisitions
expansion
discipline
businesses
* Like for Like revenue excludes both the International Cuisine acquisition for the period October to August and the Uniq desserts activities which were exited or sold
1.7% ‐1.3% 0.2%
H1 H2 FY13
Q4 +4.7% Q4 +4.7%
UK like for like revenue growth*
7
INGREDIENTS & PROPERTY
feed business benefitting from poor weather in winter and spring
in edible oils trading activity
commenced during the year
been received and are under consideration
+59.4% ‐4.1%
% change
+57.4% ‐5.3%
% change constant currency
1.6 2.5
Operating profit1
70.8 67.9
Revenue FY12 £m FY13 £m
Division represents c. 6% of Group activity Division represents c. 6% of Group activity
8
FINANCING AND TAX
Financing
and lower effective interest rate
(FY12: £18.1m) Tax
provisions and changes in corporation tax rates
Uniq acquisition
*Pension financing charge, fair value of derivatives and related debt adjustments and charge related to present value of assets and liabilities.
9
decrease of £1.6m from September 2012
PENSIONS
10
EXCEPTIONAL ITEMS
18.9
Reassessment of the utilisation of deferred tax assets
(9.2)
Property related charges
18.1
Net exceptional credit
8.1
Tax relief on exceptional items and resolution of tax positions
(8.9)
Pre tax impact
4.4
Pension curtailment gain
(1.5)
Integration costs of US acquisitions
(2.7)
Integration costs of UK acquisitions Income Statement £m
FY13 Exceptional Items
11
EPS AND DIVIDEND
12.8p 14.5p Adjusted earnings per share2 385.0m 393.6m Denominator for earnings per share £49.2m £56.9m Adjusted earnings2
FY12 FY13 EPS EPS
13.3% Dividend
per share
12.9%, in line with growth in adjusted EPS
earnings distributed
1.75p 1.9p Interim dividend per share 2.5p 2.9p Final dividend per share 4.25p 4.8p Dividend per share £16.7m £19.3m Total dividend distribution
FY12 FY13 Dividend
12
(118.2) (152.0) 33.8 4.2 (9.1) (19.4) (14.8) 72.9 (13.6) (30.4) 23.4 93.5 FY12 (20.0) Exceptionals 61.8 Operating cashflow (13.7) Pension financing (14.5) Interest & tax (11.7) Dividends paid 25.2 Decrease/(Increase) in net debt 7.3 Disposals/acquisitions 17.9 Cash inflow before M&A activity 1.6 Other including FX (34.9) Net capex 9.9 Working capital movement 101.3 EBITDA FY13 £m
CASHFLOW AND NET DEBT
Net debt at 27 September 2013 of £232.8m – equivalent to 2.3 times Net Debt/EBITDA Net debt at 27 September 2013 of £232.8m – equivalent to 2.3 times Net Debt/EBITDA
13
60 280 50 40
BORROWINGS PROFILE
years as at 26 November 2013
subsequent to year end
Bilateral Bank Facility Bank Primary Facility Private Placement Notes
£m
October 2021 October 2015 May 2016 October 2018
14
SUMMARY
‐ FINANCIAL PERFORMANCE
a challenging market
to 14.5p
12.9% to 4.8p with final proposed dividend of 2.9p
£232.8m. Net Debt/EBITDA 2.3 times
PATRICK COVENEY CHIEF EXECUTIVE OFFICER
16
FY13 PERFORMANCE PRIORITIES
DRIVE revenue and margin momentum of UK business Complete INTEGRATION of UK portfolio and set up organisation for further growth SCALE up US food to go business
17
UK CONVENIENCE PERFORMANCE
‐ MARKET CONTEXT
* Source, Nielsen, pre‐defined chilled convenience foods categories H1 : 26 w/e 30 March 2013 H2: 26 w/e 28 September 2013 FY: 52 w/e 28 September 2013
Horsemeat scandal Horsemeat scandal Endless winter Endless winter Improving consumer confidence Improving consumer confidence
H1 H1 H2 H2
Great British summer Great British summer Challenging volume environment Challenging volume environment Horsemeat impact Horsemeat impact
3.2% 1.2% 2.5%
H1 H2 FY
Chilled convenience*
1 1
18
UK CONVENIENCE PERFORMANCE
‐ TACKLING MARKET CHALLENGES Delivering margins in low growth market
reduction across portfolio
reduction across portfolio
Challenge
Seeding future growth in a challenging environment
through service, innovation, insight and collaboration
convenience and discounter channels
value for us and our customers
through service, innovation, insight and collaboration
convenience and discounter channels
value for us and our customers
Greencore Actions in FY13 Greencore Actions in FY13
1 1
19
UK CONVENIENCE PERFORMANCE
‐ DIVISIONAL HIGHLIGHTS
by good summer weather, share wins and successful range re‐ launches
Food to Go
revenue+
Food to Go
revenue+
Prepared Meals
revenue+
Prepared Meals
revenue+
Grocery
revenue+
Grocery
revenue+
decline on a like for like basis**
impacted by horsemeat scandal
performance in quiche and chilled soups
Frozen of 2.6% driven in large by cooking sauce and discount channel
retail cakes business was transferred to our Grocery category
37%*
Market share Pre‐packed sandwiches
37%*
Market share Pre‐packed sandwiches
30%*
Market share Italian CRM
30%*
Market share Italian CRM
79%*
Market share O/L cooking sauces
79%*
Market share O/L cooking sauces
8.1% H2 4.4% 0.1% FY H1
* Nielsen 52 w/e 28 September 2013 ** Excludes the impact of the International Cuisine acquisition from October to August + Category shares rounded to the nearest 5%
1 1
20
Technical, IT, HR and Purchasing
STRATEGY DELIVERY
‐ UK INTEGRATIONS SUCCESSFULLY COMPLETED
Complete Uniq Integration Complete Uniq Integration
Absorb International Cuisine Absorb International Cuisine
integrated in Food to Go
complete; disposal of Minsterley to Müller Dairy UK
2 2
21
GREENCORE USA
‐ EVOLUTION OF OUR BUSINESS
3 3
Salt Lake City, UT Jacksonville, FL Fredericksburg, VA Chicago, IL Newburyport & Brockton, MA
business
building/transfer across the Group
A food to go, multi regional, small store focused business A food to go, multi regional, small store focused business
22
Schau
desire to grow
largest US customer; 7‐Eleven
across four regions
results
year; now profitable
with our UK business
GREENCORE USA
‐ FY13 DELIVERY
3 3
23
Strong performance trajectory… Strong performance trajectory…
2.3 2.8 2.9 Net Debt /EBITDA* 12.9% 14.5 76.5 1,197.1 FY13 11.9% 10.7% ROIC % 12.8 10.5
(pence) 70.7 51.5 Operating Profit (£m) 1,161.9 804.2 Revenue (£m) FY12 FY11
STRATEGIC REVIEW
*Net Debt for FY11 adjusted to exclude flows related to Uniq and the rights issue.
… reflecting implementation
strategy … reflecting implementation
strategy
capability in Food to Go
UK and US
commitment to ‘customer brands’
successful integration of ‘on strategy’ acquisitions
cost
balance sheet
+21.9% +21.9% +13.3% +13.3%
24
STRATEGIC REVIEW
‐ A FOCUSED GROWING FOOD TO GO LEADER
UK Food to Go UK Food to Go UK Prepared Meals UK Prepared Meals UK Grocery** UK Grocery** US Food to Go US Food to Go Ingredients & Property Ingredients & Property
rate revenue*
40 20 20 15 5
Revenue
£1.2bn
Revenue
£1.2bn
* Category shares rounded to the nearest 5% ** Includes Cakes & Desserts
Food to Go long term focus driven by:
25
OUTLOOK
conditions but:
market more broadly
particularly in UK protein and dairy markets
good momentum in our businesses
further progress in FY14 and beyond
28
IAS 19 REVISED ‐ IMPACT
Estimated FY13 impact if IAS19R had been adopted Non cash financing charge is expected to increase as single liability discount rate will be used going forward ‐ previously a separate expected rate of return was applied to the assets and a finance charge applied to the liabilities. +£1.7m Non Cash Financing Charge Scheme administration costs including UK PPF levy will be recognised in the Income Statement ‐ previously charged directly to scheme liabilities. +£2.0m Operating Costs
administration costs and expected increase of non cash financing charge
29
ABOUT GREENCORE
the UK and the US
food market across food to go, chilled prepared meals, chilled soups and sauces, ambient sauces & pickles, cakes & desserts and Yorkshire puddings
serving both the convenience and small store channels
30
HISTORY
ORIGINS
a broad‐based food and agribusiness centred around the Irish sugar business
TRANSITION
the exit of sugar and the rebalancing of the portfolio
FOCUS
convenience food in the UK and the US
following the privatisation of Irish Sugar
ingredients businesses in 1990’s
food following acquisition of Hazlewood Foods in 2001
programme, which sees disposal
trading businesses
acquisitions of Uniq in 2011 and International Cuisine in 2012
four acquisitions commencing in 2008
31
BUSINESS OVERVIEW
Food to Go
Northampton, Spalding & Crosby
Food to Go
Northampton, Spalding & Crosby
Prepared Meals
meals, quiche, pasta sauce & soup
Bristol & Consett
Prepared Meals
meals, quiche, pasta sauce & soup
Bristol & Consett
Cakes & Desserts
for retail customers as well as cakes and desserts for foodservice channels
Cakes & Desserts
for retail customers as well as cakes and desserts for foodservice channels
Grocery*
sauces & pickles
puddings
Grocery*
sauces & pickles
puddings
USA
serving both the convenience and small store channel and the grocery channel
Fredericksburg (VA), Salt Lake City (UT), Chicago (IL) and Jacksonville (FL)
USA
serving both the convenience and small store channel and the grocery channel
Fredericksburg (VA), Salt Lake City (UT), Chicago (IL) and Jacksonville (FL)
Ingredients & Property
distributor of oil and fats for food processing
importers and distributors of molasses for animal feed and industrial use in Ireland
property assets
Ingredients & Property
distributor of oil and fats for food processing
importers and distributors of molasses for animal feed and industrial use in Ireland
property assets
* During FY13 management of the retail cakes business (Hull) was transferred into expanded Grocery division
32
CATEGORY SCALE IN THE UK
Food to Go
No.1 37%
No.3 22%
No.4 11%
Chilled Meal Solutions
No.1 30%
No.1 46%
No.2 37%
Other Meal Occasions
No.1 79%
No.1 59%
No.2 37%
No.1 34% Market Share Market Position
Source: Estimated Nielsen 52 w/e 28 September 2013