
SLIDE 1
1
Results from the SDSS-II Supernova Survey R.Kessler University of - - PowerPoint PPT Presentation
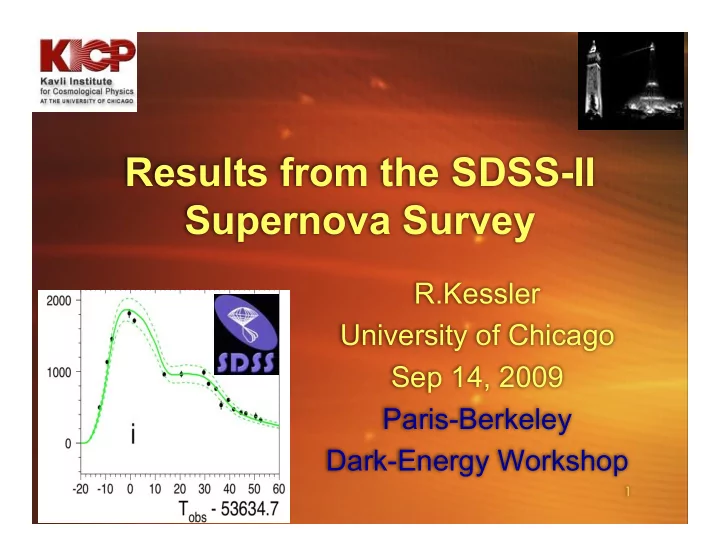
Results from the SDSS-II Supernova Survey R.Kessler University of Chicago Sep 14, 2009 Paris-Berkeley Dark-Energy Workshop 1 Outline Overview of SDSS-II Survey Analysis with existing Light curve fitters: MLCS & SALT2
1
2
3
4
What we measure with SNe … relative to empty universe
5
AJ 135, 338 (2008)
6
GOAL: Few hundred high-quality type Ia SNe lightcurves in redshift range 0.05-0.4 SAMPLING: ~300 sq deg in ugriz (3 million galaxies every two nights) SPECTROSCOPIC FOLLOW-UP: HET, ARC 3.5m, MDM, Subaru, WHT, Keck, NTT, KPNO, NOT, SALT, Magellan, TNG
7
8
9
10
data
11
12
13
14
15
16
17
18
19
20
21
22
23
24
25
26
27
28
A l l 2 8 8 S N e
29
good agreement
30
good agreement
w = –0.76 ± 0.07(stat) ± 0.11(syst) w = –0.96 ± 0.06(stat) ± 0.12(syst)
31
“SALTY”
32
33
34
35
36
37
38
Non-UV region affected due to global min smaller w-syst than MLCS
39
40
41
MLCS
42
MLCS
43
MLCS
44