
SLIDE 1
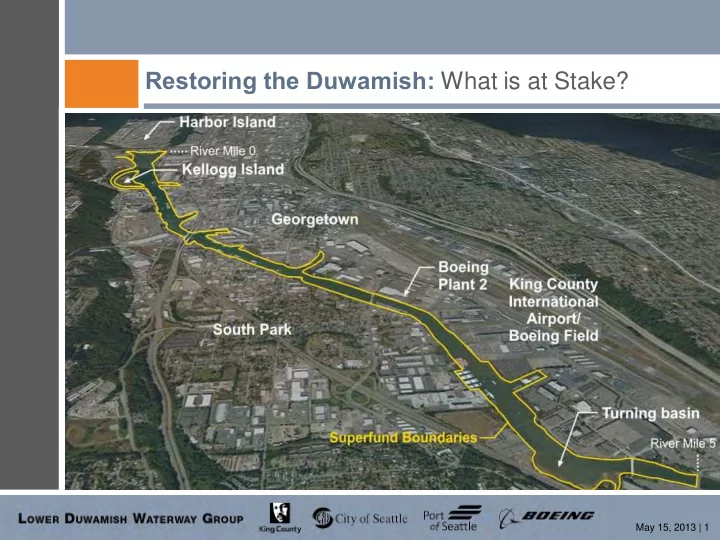
Restoring the Duwamish: What is at Stake?
May 15, 2013 | 1
Restoring the Duwamish: What is at Stake? May 15, 2013 | 1 Lower - - PowerPoint PPT Presentation
Restoring the Duwamish: What is at Stake? May 15, 2013 | 1 Lower Duwamish Waterway - Background 5-mile river segment listed due to historically contaminated sediments Legacy contamination - industrial discharges, stormwater, CSOs The
May 15, 2013 | 1
| 2
– Commercial (32%) – Industrial (26%) – Warehousing (23%) – Other uses include residential, parks, open space, military and vacant (another 19%)
| 3
2013 2014 2015 2016
Analysis
Strategy (Feb) Proposed Plan Public Comment (Feb + 105 days) Record of Decision (Q1 2014) Negotiate Agreements among PRPs and sign Consent Decree Begin Construction
2017 2018
Remedial Design
| 4
Completed
Duwamish/Diagonal sedimentation
remediation (King County)
Norfolk CSO sediment remediation
(King County)
Slip 4 remediation (City of Seattle)
| 5
Underway
Boeing Plant 2 (Boeing) Jorgensen Forge (Jorgensen) T117 (City of Seattle/Port of Seattle)
6
| 6
Lake Washington & Lake Sammamish
| 7
| 8
| 9
| 10
*These costs are not reflective of all of the proposed plan’s elements and will likely be higher.
| 11
| 12
Note: incremental costs and length of construction may be higher due to new cleanup goals in proposed plan.
50 100 150 200 250 300 350 400 450 1 2 3 4 5 6 7 8 Suggested Improvements (Key Elements) EPA Proposed Plan Suggested Improvements (Key Elements) EPA Proposed Plan
Total Net Present Value Costs ($ MM) Construction Time (years) Remedy Construction times = Period of elevated risks Both options reach same long term risk reduction (2X10⁻⁴) (2 x 10⁻⁴) (2 x 10⁻⁴)
This portion reflects increased time needed to complete additional work primarily due to more dredging.
increased risk from eating fish from the river, during construction.
significantly reduce health or environmental risks. Risk of incremental cost increase of $65M for additional tasks in the proposed plan:
surface water and tissue
compliance standards
and dredge volume
quality treatment requirements, and
This additional work will not significantly reduce long-term health or environmental risks.
| 13
| 14
| 15
| 16 200 400 600 800 1,000 1,200 1,400 1,600 1,800 2,000 1970 1975 1980 1985 1990 1995 2000 2005 2010 2015
Concentration of Total PCBs in English Sole Fillet (μg/kg ww) Year Winter 2003/2004 Duwamish/Diagonal, East Waterway, Lockheed & Todd Shipyard Dredging (~600,000 cy)
Trends in total PCB concentrations in English sole fillets in the LDW
| 17
Fish Tissue Total PCB Concentrations in the Lower Duwamish and Surrounding Urban Areas
Red-dotted line indicates EPA's proposed tissue PRG of 1.8 to 12 ug/kg ww for fish in the LDW.
500 1,000 1,500 2,000 2,500 3,000 2004 2005 2007 Steady- State Elliott Bay Lake Washington LDW Empirical Data LDW FWM- predicted Empirical Data from Nearby Urban Areas Mean Concentration of PCBs in Whole-Body Fish (μg/kg ww) English sole Perch Northern pikeminnow Yellow perch Cutthroat trout Smallmouth bass Note: A large quantity of sediment (~600,000 cy) was dredged in 2003/2004 from several areas of LDW and East/West Waterways.
6/5/2013, Filename.ppt | 18
6/5/2013, Filename.ppt | 19
Lower Duwamish Waterway
Green/Duwamish River Watershed
6/5/2013, Filename.ppt | 20
EPA’s Proposed Tissue PRG range (0.4 to 12 ppb)
Source: Ecology (2012) citing Puget Sound Action Team 2007 Note: Samples include fish from Puget Sound and results are reported in micrograms per kilogram sampled. Commercial foods were sampled as part of the U.S. Food and Drug Administration’s total diet study and market- basket survey. In most cases, data are limited by small sample sizes.
21
| 21
Note: soil samples collected from parks, schools, yards
6/5/2013, Filename.ppt | 22
| 23
| 24
Alternative 5C+
| 25
| 26 Remedy Concern How Addressed in LDWG Key Elements Memo How Addressed in EPA Remedy (Proposed Plan) Use of natural recovery for non-human health risk drivers and providing flexibility for urban chemicals (i.e., phthalates) and transient signatures (i.e., benzoic and phenolic compounds)* Allow 10 years for non-human health risk-drivers to achieve Washington State Sediment Quality
transient chemicals (higher trigger concentrations). Similar, but limits the use of recovery by using lower RALs for certain chemicals; no allowance for urban and transient chemicals. Cap and ENR performance (stability)** Use where feasible with armoring as necessary (e.g., placement of material with larger grain size). Monitoring, maintenance and repair. Armor as necessary. Limit use to areas with low scour potential. Employ subsurface RAL to limit use of capping and ENR. Reduce the availability of bioaccumulating contaminants (PCBs, dioxins/ furans) *** Reduce through carbon amendments in ENR
technologies. Similar, but limit ENR only to areas with low contamination regardless of carbon amendment use. Exposure of subsurface contamination from scour or seismic events** Use armoring in areas with high scour potential (Category 1). Monitor areas with lower scour potential (Categories 2 and 3) and perform contingency actions if necessary. Incorporate a subsurface remedial action level to remove buried contamination regardless of stability or bioavailability. Limited use of ENR. Approach for achieving natural background cleanup level of 2 ppb for PCBs * Provide a technical impracticability waiver prior to remediation. Models predict that long-term concentrations will asymptote to approximately 40-50 ppb for PCBs. Provide technical impracticability waiver after years of monitoring and review of site conditions for possible additional actions. Resident Seafood Tissue Goals * Develop likely achievable tissue targets and monitor progress towards these targets. Set enforceable tissue cleanup level at natural background (which is unattainable in urban area based on all available information). Surface Water Goals* Surface water quality is managed by other programs. Set enforceable surface water cleanup levels at the Federal HH recommended water quality criterion (0.064 ng/L), which is below upstream concentrations and within the range of laboratory method blanks. *LDWG concern; ** EPA concern; *** LDWG request and EPA adjustments