
1
I nteragency Working Group
February 11, 2011
2035 Plan: Post-Referendum Analysis
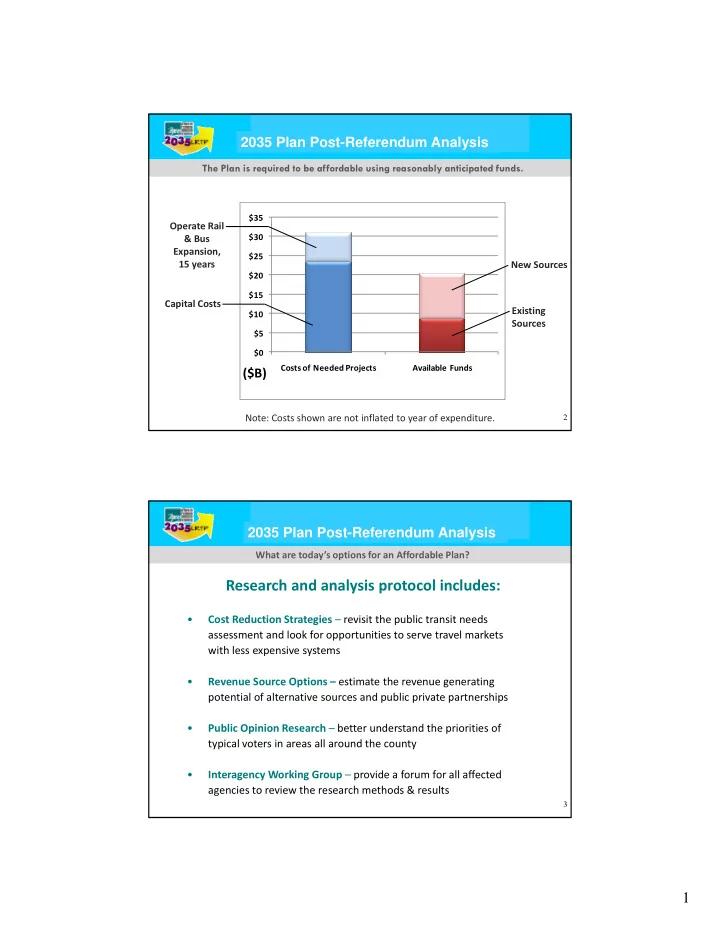
The Plan is required to be affordable using reasonably anticipated funds.
$35
2035 Plan Post-Referendum Analysis
$10 $15 $20 $25 $30 $35
Capital Costs Operate Rail & Bus Expansion, 15 years New Sources Existing Sources
2
$0 $5 Costs of Needed Projects Available Funds
($B)
Note: Costs shown are not inflated to year of expenditure. Sources
I nteragency Working Group
February 11, 2011
2035 Plan: Post-Referendum Analysis
Research and analysis protocol includes:
What are today’s options for an Affordable Plan?
2035 Plan Post-Referendum Analysis
- Cost Reduction Strategies – revisit the public transit needs
assessment and look for opportunities to serve travel markets with less expensive systems
- Revenue Source Options – estimate the revenue generating
potential of alternative sources and public private partnerships
3
- Public Opinion Research – better understand the priorities of
typical voters in areas all around the county
- Interagency Working Group – provide a forum for all affected
agencies to review the research methods & results