
SLIDE 1
REPRODUCTIVE HEALTH: R&D FOR THE DEVELOPING WORLD
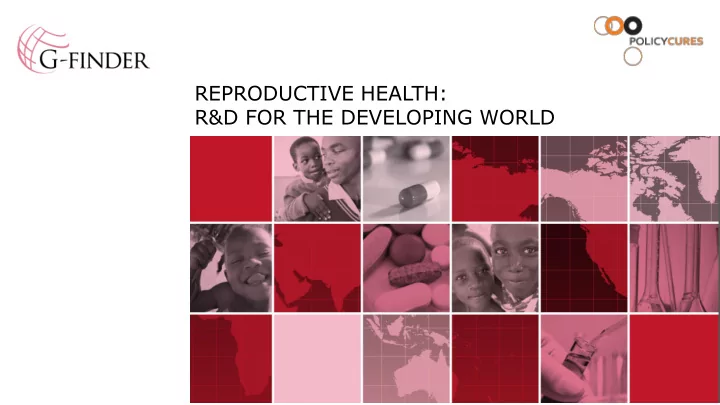
REPRODUCTIVE HEALTH: R&D FOR THE DEVELOPING WORLD POLICY CURES - - PowerPoint PPT Presentation
REPRODUCTIVE HEALTH: R&D FOR THE DEVELOPING WORLD POLICY CURES An independent non-profit research group Innovative ideas and rigorous analysis Focussed on R&D for neglected diseases of the developing world
REPRODUCTIVE HEALTH: R&D FOR THE DEVELOPING WORLD
POLICY CURES
research group
analysis
diseases of the developing world
REPRODUCTIVE HEALTH: NOW PART OF THE G-FINDER SURVEY
neglected disease R&D funding
specific reproductive health R&D for the first time
comprehensive analysis
Gates Foundation
WHY INCLUDE REPRODUCTIVE HEALTH?
225 million women who need safe and effective contraception 39 million new cases of chlamydia, gonorrhoea & trichomoniasis in African women alone 3.3 million DALYs lost from postpartum haemorrhage The developing world still has:
developing country needs
G-FINDER REPRODUCTIVE HEALTH SCOPE & METHODOLOGY
Findings OVERALL FUNDING
invested in DC-specific reproductive health R&D in 2013
Findings CONTRACEPTIVES
Contraceptives received nearly ¾ of this investment
71%
71%
Findings FUNDING PER AREA
Contraceptives Core funding MPTs Unspecified Postpartum haemorrhage Platform technologies Non-HIV STIs
$63m $9.2m $3.5m $4.0m $6.5m $1.8m $0.4m
Findings FUNDERS
Industry 41% Public 30% Philanthropy 29%
$36m from companies $24m from Gates $11m from USAID
Less than $6m from any other funder
By organisation By sector
Findings GLOBAL FUNDING DISTRIBUTION
Australia $0.5 million
Findings THE MAJOR PRODUCT DEVELOPERS
Industry 45% PDPs and intermediaries 24% Academic institutes 21% Public 9.4%
$40m for companies (mostly self) $14m for FHI 360 $13m for Population Council
Less than $6m for any other developer
By sector By organisation
Download the report at http://policycures.org/gfinder.html