Regional-STRATEAU STRATEAU is a tool of strategic analysis and - - PDF document

regional strateau
SMART_READER_LITE
LIVE PREVIEW

Regional-STRATEAU STRATEAU is a tool of strategic analysis and - - PDF document

Regional-STRATEAU STRATEAU is a tool of strategic analysis and outlook on water availability-demand balance over regional areas. It relies on a consistent database that combines structural characteristics of the territory and observed data. The


slide-1
SLIDE 1

STRATEAU is a tool of strategic analysis and outlook on water availability-demand balance over regional areas. It relies on a consistent database that combines structural characteristics of the territory and observed data. The reconstitution is homogeneous at different administrative and hydraulic scales, and for the different sectors addressed: agriculture, households, industries, services or energy.

Model architecture

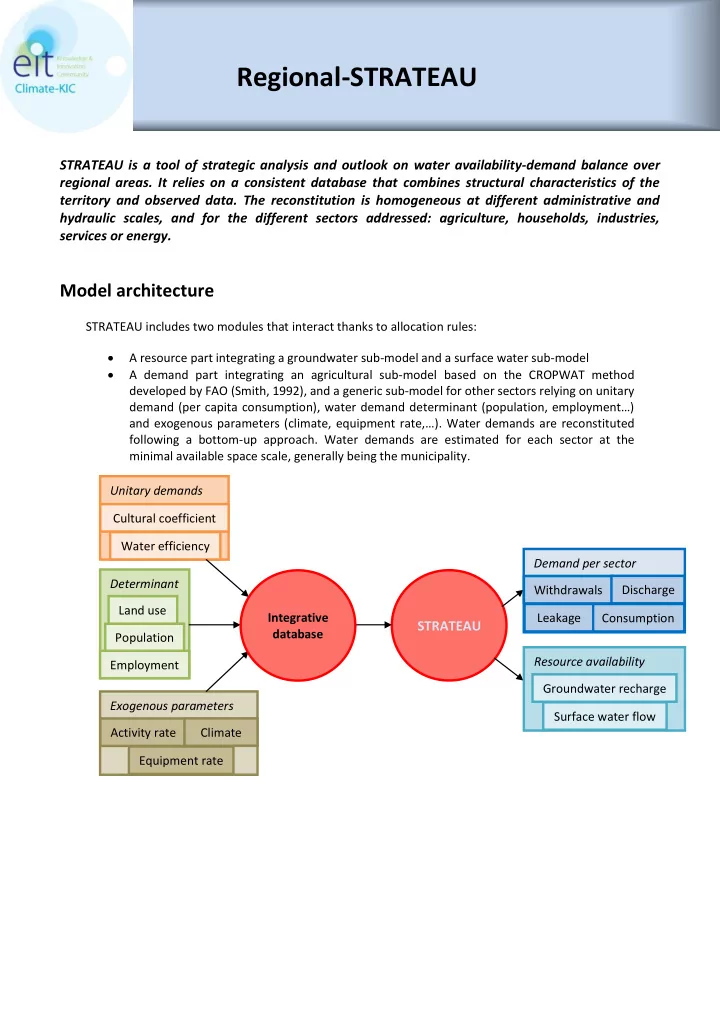
STRATEAU includes two modules that interact thanks to allocation rules:  A resource part integrating a groundwater sub-model and a surface water sub-model  A demand part integrating an agricultural sub-model based on the CROPWAT method developed by FAO (Smith, 1992), and a generic sub-model for other sectors relying on unitary demand (per capita consumption), water demand determinant (population, employment…) and exogenous parameters (climate, equipment rate,…). Water demands are reconstituted following a bottom-up approach. Water demands are estimated for each sector at the minimal available space scale, generally being the municipality.

Regional-STRATEAU

Determinant Population Land use Employment

STRATEAU

Exogenous parameters Activity rate Climate Equipment rate Resource availability Groundwater recharge Surface water flow Demand per sector Withdrawals Discharge Consumption Leakage Unitary demands Cultural coefficient Water efficiency Integrative database

slide-2
SLIDE 2

The outputs are available at four scales at a monthly time step:  Two hydrologic scales: river basin or sub-river basin  Two administrative scales: regional (country, region) or local scale (municipality) Homogeneous estimations are carried out at the municipal scale by prorating data available at the hydrologic scale (and conversely). Calculations are later undertaken at the smallest available scale (sub-basin and municipality) and results are aggregated to provide a representation at the regional or at the river-basin scale, following a bottom-up approach.

Module description:

Main processes being represented In the demand module, water requirement are calculated based on unitary demands, determinants and exogenous factors. These requirements are then fulfilled from the available resources (direct withdrawals from surface or underground resources, drinking water network). Leakages as well as consumptive uses are integrated and allow calculating water discharges in the different water bodies. In the resource module, aquifer recharge and river flows are impacted by withdrawals, leakages and

  • discharges. Rainfalls are translated into runoffs to surface water and infiltration in aquifers based on
slide-3
SLIDE 3

Footprint SUGAR index, which estimates the probability of rainfall to infiltrate or to run-off with surface water1. Description of the inputs Input Type Variable identification and metric Temporal / spatial scale Default source of data in past Source of data for future scenarios Climate Climatic grid Area or Raster SAFRAN (Fr), SIA (Es) Regionalized scenarios Land use Percentage of each surface management type :

  • Irrigated / non irrigated acreage
  • Orchard
  • Wheat
  • Rice
  • Garden Market
  • Grass irrigated / non irrigated
  • Vineyards
  • Olives …
  • Forest
  • Golf curses
  • Urban area

Municipality

  • r county

Corinne Land Cover (UE) Recensement Général Agricole (Fr), Censo Agrario (Es) Regionalized scenarios Soil Infiltration rate (%) Area IDPR (France), FootPrint SUGAR index (UE) Regionalized scenarios Population Municipal population Dwelling type Municipality National Census, INSEE (Fr), INE (Es) Trends Employment Employees per sub-sector Municipality SIRENE (Fr), INE (Es) Trends Description of the outputs Various outputs can be provided through tables, charts or interactive maps:  Territorialized water demands per sector (withdrawals, discharges, consumption)  River flows and aquifer recharge Time scale: year or month. Space scale: hydrologic (sub-river basin or river basin) and administrative scale (municipality to region).

1 http://www.eu-footprint.org/sugar.html

slide-4
SLIDE 4

Condition of access to the model codes

  • Condition of access to the model codes
  • Licensing condition or subcontracting: please contact French Water Embassy or

SAFEGE (innovation@safege.fr)

  • Cost: according to the country and the river basin size.

Bibliographie

Smith, M. (1992). CROPWAT: A computer program for irrigation planning and management.46. Food & Agriculture Org.,