
SLIDE 1
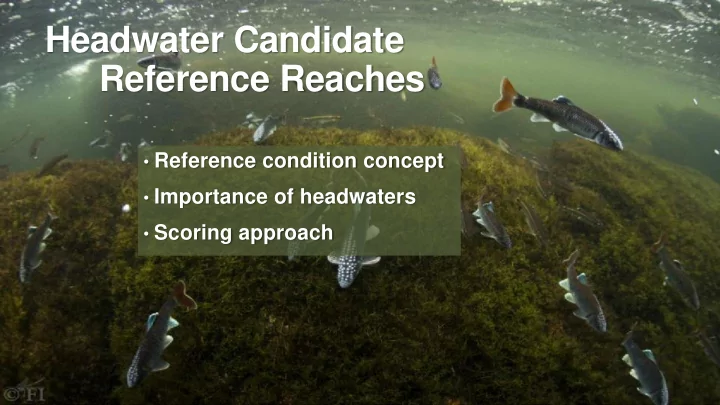
Headwater Candidate Reference Reaches
- Reference condition concept
- Importance of headwaters
- Scoring approach
Reference Reaches Reference condition concept Importance of - - PowerPoint PPT Presentation
Headwater Candidate Reference Reaches Reference condition concept Importance of headwaters Scoring approach Reference Condition Ecological integrity is defined as the capability of supporting and maintaining a balanced,
Ecological integrity is defined as “the capability of supporting and maintaining a balanced, integrated, adaptive community of organisms having species composition, diversity, and functional organization comparable to that of natural habitat of the region” Drivers of stream condition
Ozark Grassland
Ecological integrity is defined as “the capability of supporting and maintaining a balanced, integrated, adaptive community of organisms having species composition, diversity, and functional organization comparable to that of natural habitat of the region”
Davies and Jackson 2006 Stressor Gradient
Low High
Biological Condition
Natural Degraded
members of stream networks
Typically <10 km2 watershed area Closely linked to landscape 79% of river length in US Maintain stream flows, sediment loads, nutrient inputs, etc. Often under-sampled
Landscape-level threat indexing Multimetric index
Colvin et al. 2019. Fisheries 44(2):73-91
Metric Date Published Source CAFO* Sites (no./km2) 2012 Missouri Department of Natural Resources NPDES† Sites (no./km2) 2012 Missouri Department of Natural Resource Landfills (no./km2) 2008 Missouri Department of Natural Resources Registered Hazardous Waste Sites (no./km2) 2010 Missouri Department of Natural Resources Superfund Sites (no./km2) 2010 Missouri Department of Natural Resources Dams (no./km) 2010 Missouri Department of Natural Resources Road/Stream Crossings (no./km) 2008 Missouri Resource Assessment Partnership Coal Mines (no./km2) 2008 Missouri Resource Assessment Partnership Lead Mines (no./km2) 2007 Missouri Resource Assessment Partnership Mines (Other) (no./km2) 2007 Missouri Resource Assessment Partnership Sand/Gravel Mines (no./km) 2008 Missouri Department of Natural Resources Cultivated Crop (% watershed area) 2006 Multi-Resolution Land Characteristics Consortium Pasture/Hay (% watershed area) 2006 Multi-Resolution Land Characteristics Consortium Imperviousness (% watershed area) 2006 Multi-Resolution Land Characteristics Consortium
cultivated crops (CC) (% area within watershed)
Yoder et al. 1999, Paul and Meyer 2001
found
75th percentile 50th percentile 25th percentile Max Min
(Excludes zero values)
# stream crossings Score 4 3 2 1 Repeat for 11 additional metrics
Sum all 14 scores = Disturbance index score Quartiles for remaining 12 metrics
Watershed Area Quartile Watershed Size
Watershed Area Quartile
Watershed Size
using same threshold/quartile approach
disturbance) for any metric
Examples:
ID Crops Imp Surface Dams Pasture/Hay Mines SG Stream Xings Mines Coal Mines Lead CAFOs Mines Other Landfills NPDES Superfund Hzrd Waste 4161 1 1 3 4 923 3 1 3 4 5773 3 1 3
balanced, integrated, adaptive community of organisms having species composition, diversity, and functional organization comparable to that of natural habitat of the region”
Severe alteration of structure and function
Davies and Jackson 2006 Stressor Gradient
Low High
Biological Condition
Natural Degraded
1 3 5 4 6
Native or natural condition Minimal loss of species; some density changes may occur Some replacement of sensitive-rare species; functions fully maintained Some sensitive species maintained but notable replacement by more- tolerant taxa; altered distributions; functions largely maintained Tolerant species show increasing dominance; sensitive species are rare; functions altered
2 Ideal Realistic: Least threatened
Metric Date Published Source CAFO* Sites (no./km2) 2012 Missouri Department of Natural Resources NPDES† Sites (no./km2) 2012 Missouri Department of Natural Resource Landfills (no./km2) 2008 Missouri Department of Natural Resources Registered Hazardous Waste Sites (no./km2) 2010 Missouri Department of Natural Resources Superfund Sites (no./km2) 2010 Missouri Department of Natural Resources Dams (no./km) 2010 Missouri Department of Natural Resources Road/Stream Crossings (no./km) 2008 Missouri Resource Assessment Partnership Coal Mines (no./km2) 2008 Missouri Resource Assessment Partnership Lead Mines (no./km2) 2007 Missouri Resource Assessment Partnership Mines (Other) (no./km2) 2007 Missouri Resource Assessment Partnership Sand/Gravel Mines (no./km) 2008 Missouri Department of Natural Resources Cultivated Crop (% watershed area) 2006 Multi-Resolution Land Characteristics Consortium Pasture/Hay (% watershed area) 2006 Multi-Resolution Land Characteristics Consortium Imperviousness (% watershed area) 2006 Multi-Resolution Land Characteristics Consortium
Annis, G. M., and coauthors. 2010. Developing synoptic human threat indices for assessing the ecological integrity of freshwater ecosystems in EPA Region 7. University of Missouri, Columbia, Missouri. Hyndman, R. J., and Y. Fan. 1996. Sample quantiles in statistical packages. The American Statistician 50:361-365. Kleekamp, E. 2016. Development of reference reaches for Missouri streams. Final Report to the Missouri Department of Natural Resources, Watershed Protection Program. Report Number G13- NPS-08, Jefferson City, MO. Paul, M. J., and J. L. Meyer. 2001. Streams in the urban landscape. Annual Review of Ecology and Systematics 32(1):333-365. Roth, N. E., J. D. Allan, and D. L. Erickson. 1996. Landscape influences on stream biotic integrity assessed at multiple spatial scales. Landscape Ecology 11(3):141-156. Sowa, S. P., G. Annis, M. E. Morey, and D. D. Diamond. 2007. A gap analysis and comprehensive conservation strategy for riverine ecosystems of Missouri. Ecological Monographs 77(3):301-334. Wang, L., J. Lyons, P. Kanehl, and R. Gatti. 1997. Influences of watershed land use on habitat quality and biotic integrity in Wisconsin streams. Fisheries 22(6):6-12. Yoder, C. O., R. J. Miltner, and D. White. 1999. Assessing the status of aquatic life designated uses in urban and suburban watersheds. Proceedings of the National Conference of Retrofit Opportunities for Water Resource Protection in Urban Environments. Pp. 16-28. EPA/625/R-99/002.
Central Plains
~ 10.3 m/km headwater gradient Ozarks
~ 17.4 m/km headwater gradient MS Alluvial Basin
~ 2.6 m/km headwater gradient