
SLIDE 1
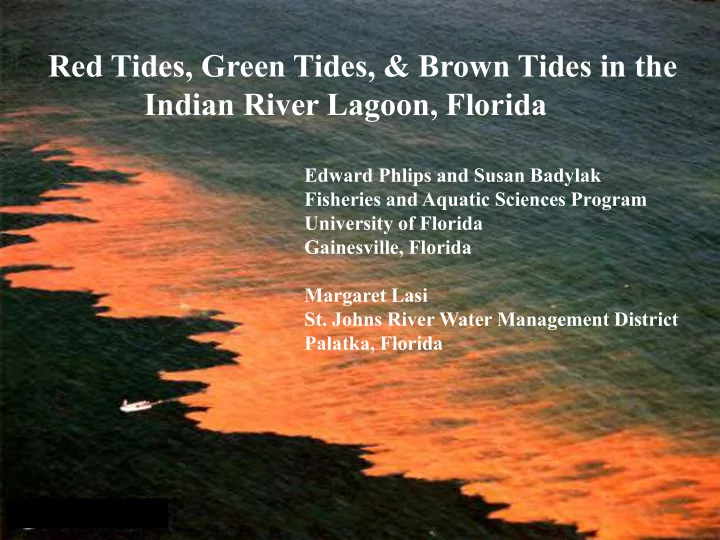
Red Tides, Green Tides, & Brown Tides in the Indian River Lagoon, Florida
Edward Phlips and Susan Badylak Fisheries and Aquatic Sciences Program University of Florida Gainesville, Florida Margaret Lasi
- St. Johns River Water Management District