
SLIDE 1
FY 2015 Proposed Budget – City of San Antonio
1
RECYCLING PLAN Development 2013 2009 -2010 Residential City - - PowerPoint PPT Presentation
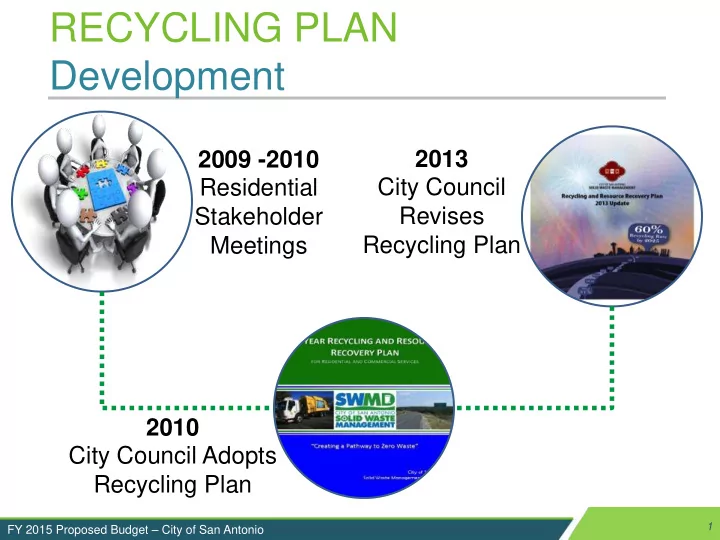
RECYCLING PLAN Development 2013 2009 -2010 Residential City Council Stakeholder Revises Meetings Recycling Plan 2010 City Council Adopts Recycling Plan 1 FY 2015 Proposed Budget City of San Antonio RECYCLING PLAN A Pathway To
FY 2015 Proposed Budget – City of San Antonio
1
FY 2015 Proposed Budget – City of San Antonio
2
FY 2015 Proposed Budget – City of San Antonio
3
FY 2015 Proposed Budget – City of San Antonio
4
FY 2015 Proposed Budget – City of San Antonio
5
FY 2015 Proposed Budget – City of San Antonio
6
FY 2015 Proposed Budget – City of San Antonio
7
FY 2015 Proposed Budget – City of San Antonio
8
FY 2015 Proposed Budget – City of San Antonio
9
1,000 2,000 3,000 4,000 5,000 6,000 7,000 8,000 1985 1986 1987 1988 1989 1990 1991 1992 1993 1994 1995 1996 1997 1998 1999 2000 2001 2002 2003 2004 2005 2006 Communities
Sources: Miranda, M.L. (1999). Unit Based Pricing in the United States: A Tally of Communities. Duke University. Skumatz, L. and Freeman, D.(2006). “Pay as you Throw (PAYT) in the US. 2006 Update and Analysis”, prepared for US EPA and SERA from a total of 27,000 communities
FY 2015 Proposed Budget – City of San Antonio
10
Source Reduction 6%
Skumatz, L. and Freeman, D.(2006). “Pay as you Throw (PAYT) in the US. 2006 Update and Analysis”, prepared for US EPA and SERA from a total of 27,000 communities
FY 2015 Proposed Budget – City of San Antonio
11
Generates ¡about ¡73 ¡ pounds ¡of ¡trash ¡ every ¡week ¡ ¡ Equivalent ¡to ¡8 ¡ kitchen ¡trash ¡bags ¡
VARIABLE ¡RATE ¡PRICING ¡
FY 2015 Proposed Budget – City of San Antonio
12
Generates ¡about ¡73 ¡ pounds ¡of ¡trash ¡ every ¡week ¡ ¡ Equivalent ¡to ¡8 ¡ kitchen ¡trash ¡bags ¡
VARIABLE ¡RATE ¡PRICING ¡
FY 2015 Proposed Budget – City of San Antonio
13
FY 2015 Proposed Budget – City of San Antonio
14
Monthly Fee FY 2014 FY 2015 FY 2016 FY 2017 FY 2018 FY 2019 Small Cart N/A N/A $21.68 $21.93 $20.93 $19.93 Medium Cart N/A N/A $22.18 $23.43 $24.18 $24.93 Large Cart $19.93 $20.93 $23.43 $25.93 $27.93 $29.93 Small to Large Difference $0.00 $0.00 $1.75 $4.00 $7.00 $10.00
$22.75 $23.43 $26.80 $47.55 $92.52 $0 $20 $40 $60 $80 $100 Fort Worth San Antonio* Phoenix Austin San Jose
* Projected in FY 2016
FY 2015 Proposed Budget – City of San Antonio
15
Solid ¡Waste ¡Fund ¡ FY ¡2014 ¡ FY ¡2015 ¡ $ ¡Change ¡ Expenses ¡ $97.8 ¡ $100.2 ¡ ¡ $2.4 ¡ ¡ Revenues ¡ $97.8 ¡ $100.2 ¡ $3.4 ¡ Posi;ons ¡ 567 ¡ ¡ 564 ¡ ¡ (3) ¡ Garbage ¡ CollecMon ¡ ¡$38.4 ¡ ¡ 38% ¡ Recycling ¡& ¡ Waste ¡ Diversion ¡ ¡$29.5 ¡ ¡ 30% ¡ Brush ¡& ¡Bulky ¡ CollecMon ¡ ¡$16.4 ¡ ¡ 16% ¡ Drop ¡Off ¡ Centers ¡ ¡$6.6 ¡ ¡ 7% ¡ Total ¡Expenses: ¡$100.2 ¡M ¡ ($ ¡in ¡Millions) ¡ Solid ¡Waste ¡ Fee ¡ ¡ $78.4 ¡ 78% ¡
$15.3 ¡ 15% ¡ Total ¡Revenues: ¡$100.2 ¡M ¡ ($ ¡in ¡Millions) ¡ Recycling ¡$3.2 ¡(3%) ¡ Organics ¡$0.6 ¡(1%) ¡ Brush ¡Recycling$0.7 ¡(1%) ¡ AdministraMon ¡$3.4 ¡(3%) ¡ Landfill ¡Management ¡$2.4 ¡(2%) ¡ Transfers ¡$3.5 ¡(4%) ¡ Permits, ¡Transfers, ¡Other ¡$2.0 ¡(2%) ¡
FY 2015 Proposed Budget – City of San Antonio
16
FY 2015 Proposed Budget – City of San Antonio
17
Heavy Truck & Off Road Equipment Light-Duty & Police Vehicles
FY 2015 Proposed Budget – City of San Antonio
18
Fund ¡ FY ¡2014 ¡ FY ¡2015 ¡ $ ¡Change ¡ Solid ¡Waste ¡ $98 ¡ $100 ¡ $2 ¡ Fleet ¡Services ¡ $0 ¡ $17 ¡ $17 ¡ Capital ¡Projects* ¡ $3 ¡ $2 ¡ ¡ ($1) ¡ TOTAL ¡ $101 ¡ $119 ¡ $18 ¡ Posi;ons ¡ 567 ¡ ¡ 663 ¡ 96 ¡ Total ¡Solid ¡Waste ¡Department: ¡$119 ¡M ¡ ($ ¡in ¡Millions) ¡ Solid ¡Waste ¡ Fund ¡ ¡ $100 ¡ 84% ¡ Fleet ¡ Services ¡ ¡ $17 ¡ 14% ¡ Capital ¡Projects ¡ $2 ¡ 2% ¡
*$5 Million appropriated in FY 2014 for 2 Bulky Drop-Off Centers and Bitters Recycling Center crew quarters to be spent over 2 fiscal years