Reconstructed global temperature over the last 420000 years based - - PowerPoint PPT Presentation

reconstructed global temperature over the last 420 000
SMART_READER_LITE
LIVE PREVIEW

Reconstructed global temperature over the last 420000 years based - - PowerPoint PPT Presentation

Probable beginning Earliest Agriculture begins of Homo sapiens Homo sap. in Africa Reconstructed global temperature over the last 420000 years based on the Vostok ice core from the Antartica (Petit et al. 2001) It has been the last


slide-1
SLIDE 1

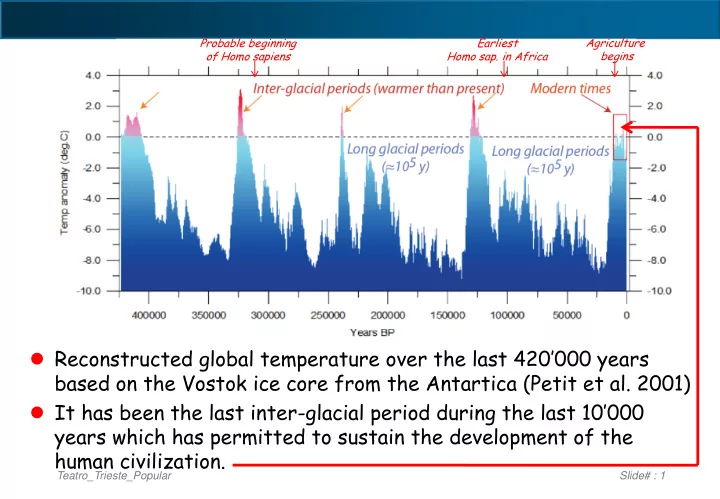
 Reconstructed global temperature over the last 420’000 years based on the Vostok ice core from the Antartica (Petit et al. 2001)  It has been the last inter-glacial period during the last 10’000 years which has permitted to sustain the development of the human civilization.

Teatro_Trieste_Popular Slide# : 1 Agriculture begins Earliest Homo sap. in Africa Probable beginning

  • f Homo sapiens
slide-2
SLIDE 2

2000 years of temperatures in the 30-90° North hemisphere

Teatro_Trieste_Popular Slide# : 2

 Earth's climate has changed naturally between cooler and warmer conditions on a millennial timescale.  Extra-tropical Northern Hemisphere (90–30°N) decadal mean temperature variations (dark grey line) relative to the 1961–1990 mean temperature with 2 standard deviations bars

Ljungquist,2010

slide-3
SLIDE 3

Teatro_Trieste_Popular Slide# : 3

An “associated” global temperature pattern (C°)?

Recovery from volcanic eruptions dominates (global brightening) Tropospheric aerosols mask warming (global dimming) Greenhouse gases dominate

slide-4
SLIDE 4

Teatro_Trieste_Popular Slide# : 4

 From about 6 GtC/y in 1995, we are now at 9.5 GtC/y. By 2020 and at the present rate CO2 will reach ≈ 12 GtC/y.

Man made fossil CO2 emissions are rising at a rapid pace

IPCC A1B predictions

  • f a fully uncurbed

emission process

slide-5
SLIDE 5

BUT, has the Anthropogenic warming slowed down ?

Teatro_Trieste_Popular Slide# : 5

 Average temperature and CO2 emissions over the last 17 years show a small temperature drop rather than a significant rise, in contrast with more naïve previous extrapolations.

? ? Expected IPCC A1B Observed

slide-6
SLIDE 6

Teatro_Trieste_Popular Slide# : 6

? ? ? Expected Observed

slide-7
SLIDE 7

Five independent global estimates

Teatro_Trieste_Popular Slide# : 7

slide-8
SLIDE 8

Teatro_Trieste_Popular Slide# : 8

http://theclimatescepticsparty.blogspot.de/2014/02/england-passes-wind-and-discovers-heat.html

Trend: -0,00 (-0.01) C°/century

Hadcrut3 data

slide-9
SLIDE 9

Teatro_Trieste_Popular Slide# : 9

Contribution to the growth

Primary energy growth during the next 25 years (IEA)

slide-10
SLIDE 10

The main pillars of the European energy policy

 During as many as twenty years, the energy policy has been determined by two main priorities:

  • The first strategic priority for the European Union has been

the one to prevent dangerous climatic changes

  • The second consideration is based on the assumption that the

energy prices will rise inexorably as global energy demand rises and the resources become scarce and this will necessarily make renewable energies competitively the winners  The resulting energy policy by 2020 is based on the so-called EU "20-20-20" climate and energy package, namely:

  • 20% reduction of CO2 emissions from 1990
  • 20% of EU energy produced from renewables
  • 20% improvement in EU energy efficiency.

 By circa 2040 about 80% of the EU primary energy should eventually come from renewables

Teatro_Trieste_Popular Slide# : 10

slide-11
SLIDE 11

European Energy System based on renewable Sources

Teatro_Trieste_Popular Slide# : 11

106 t CO2eq

– 95%

Greenhouse Gas Neutral Germany

Greenhouse gas emission reductions is a top priority. The goal of German energy policy is to reduce such emissions by at least 40 percent by 2020 and by 80 to 95 percent by 2050, relative to 1990 levels. Hydrogen electrically produced by PV, Hydro, Wind, Geoth. and Solar are the main energy sources of Industry and Transport

1990 2050

Electricity Hydrogen Heat

slide-12
SLIDE 12

Teatro_Trieste_Popular Slide# : 12

Gerhard Knies, ISES-Rome CSP WS 2007

1700 TWhel/y 1090 TWhel/y 750 TWhel/y 890 TWhel/y 1 GWhel/km²/y 1 GWhel/km²/y  30 GWhel/km²/y  30 GWhel/km²/y

Typical Yield Economic potentials

Economic potentials > 600 000 TWhel/y Typical yield CSP, PV250 GWhel/km²/y Demand of electric power: » 7 500 TWh/y Europe + Desert 2050 » 35 000 TWh/y world-wide 2050 Biomass Wind Geothermal Hydropower

slide-13
SLIDE 13

1000 km

A new role of renewable energies in Europe: wind

 In line with the commitments taken by the Member States for 2020 and beyond, wind energy should indeed become the most prominent renewable resource to be used in Europe to contribute to GHG emission abatement.

Teatro_Trieste_Popular Slide# : 13

.

slide-14
SLIDE 14

Teatro_Trieste_Popular Slide# : 14

Wind off-shore: average power 6 MW/unit

Up to 700 m deep

slide-15
SLIDE 15

Wind

Teatro_Trieste_Popular Slide# : 15

 Wind variability in Germany. Percentage of electrical demand delivered by all the wind turbines of E.ON Energie during the year 2007. Averaged over the year, wind power delivered 18% of installed capacity. (Courtesy of E.ON Energie)

slide-16
SLIDE 16

Teatro_Trieste_Popular Slide# : 16 Slide# : 16

The EU-MENA Solar project in Europe

The planned EURO-MED electricity interconnection permits to produce from the Sahara large amounts of wind/solar electricity toward the Pan- European network. By 2050 Area: 2500 km2 HV Lines 4000 km2 Capacity: 100 GWatt Transfer:700TWh/y EU needs:7500TWh/y Costs: Turnover: 35 G€/y Solar 350 G€ HV lines: 50 G€ Nasser Lake area = Oil + Gas from Saudi Arabia Electricity by 2050

slide-17
SLIDE 17

The shale revolution in the US

 In 1967, Herman Kahn and Anthony

  • J. Wiener published The Year 2000:

A Framework for Speculation on the Next Thirty-Three Years.  It predicted that by the year 2000, there would be "commercial extraction of oil from shale.“  “We conclude that the proven reserves of these five major fossil fuels (oil, natural gas, coal, shale oil and tar sands) alone could provide the world's total energy requirements for about 100 years, and only one-fifth of the estimated potential resources could provide more than 200 years of the projected energy needs." --

Teatro_Trieste_Popular Slide# : 17

slide-18
SLIDE 18

1.-Gas Naturale da scisti

 Shales are sedimentary rocks formed from deposits of mud, silt, clay and organic matter.  Hydraulic fracturing involves pumping of water mixed with chemicals at high pressure into a well that has been

  • drilled. The fluid

creates fractures in the rock, in order to get the gas out.

Teatro_Trieste_Popular Slide# : 18

slide-19
SLIDE 19

2.-Metano da sedimento carbonifero

Teatro_Trieste_Popular Slide# : 19

 CBM is Coalbed Methane adsorbed into a solid coal matrix (macerals) released if the coal seam is depressurised.  Methane is extracted by drilling wells into the coal seam. The water pressure is decreased by pumping water from the

  • well. The decrease in

pressure allows methane to desorb from the coal and flow as a gas up the well to the surface

slide-20
SLIDE 20

Consumi di gas naturale

Teatro_Trieste_Popular Slide# : 20

Units are in Million BTU

slide-21
SLIDE 21

Gas naturale vs. Carbone

Teatro_Trieste_Popular Slide# : 21

slide-22
SLIDE 22

Teatro_Trieste_Popular Slide# : 22

slide-23
SLIDE 23

Teatro_Trieste_Popular Slide# : 23

slide-24
SLIDE 24

Teatro_Trieste_Popular Slide# : 24

slide-25
SLIDE 25

Teatro_Trieste_Popular Slide# : 25

slide-26
SLIDE 26

Teatro_Trieste_Popular Slide# : 26

slide-27
SLIDE 27

World-wide Shale resources are global & massive

Teatro_Trieste_Popular Slide# : 27

slide-28
SLIDE 28

CBM reserves

Teatro_Trieste_Popular Slide# : 28

Units are in Trillion ft3

slide-29
SLIDE 29

China

Teatro_Trieste_Popular Slide# : 29

 China has 900 trillion ft3

  • f potentially

recoverable shale gas – enough to supply the country’s needs for nearly 200 years at current levels.  The goal is to produce 0.25 trillion ft3 of shale gas annually by 2015 and 2.5 trillion ft3 annually by 2020, a huge leap from today.

Conversion: 1m³ = 35.315ft³

slide-30
SLIDE 30

Teatro_Trieste_Popular Slide# : 30

slide-31
SLIDE 31

European resources

Teatro_Trieste_Popular Slide# : 31

Trillion ft3

slide-32
SLIDE 32

Teatro_Trieste_Popular Slide# : 32

NG for EU industry are more than 3x higher than in the US

Natural Gas

slide-33
SLIDE 33

Teatro_Trieste_Popular Slide# : 33

EU industry pays twice as much for its electricity

Electricity

slide-34
SLIDE 34

Teatro_Trieste_Popular Slide# : 34

Chemicals

EU prices are four times higher than US ethane US chemical trade surplus could rise fast : 800 m in 2012 2.7 bn in 2013 46 bn by 2020

slide-35
SLIDE 35

Ethylene Chemical industry boom

 Renewed US competitiveness: the United States is now a low-cost producer, thanks to shale gas. For instance US ethylene production costs are a third of those in Europe

Teatro_Trieste_Popular Slide# : 35

slide-36
SLIDE 36

Clathrates: the largest reserves of hydrocarbons on the crust

 Methane hydrate is a natural form of clathrate, a chemical substance in which molecules of water form an

  • pen solid lattice that

encloses, without chemical bonding, appropriately-sized molecules of methane.  At high pressure methane clathrates remain stable up to 18 °C. One litre of methane clathrate contains as much as 168 litres of methane gas.

Teatro_Trieste_Popular Slide# : 36

Burning Ice

slide-37
SLIDE 37

 The US Energy Information Administration estimates that methane hydrates contain more carbon than all other fossil fuels available on Earth combined.  Methane hydrates are the largest reserve of hydrocarbons in the planetary crust. The methane hydrates in sediment considered part of U.S. territory alone could supply U.S. natural gas needs for > 103 years.

Teatro_Trieste_Popular Slide# : 37

Oil ≈ 200 GtC Coal ≈ 5000 GtC Clathrates >12000 GtC

slide-38
SLIDE 38

The very vast experimental evidence of clathrates

Teatro_Trieste_Popular Slide# : 38

slide-39
SLIDE 39

Can we reconcile NG production with global warming ?

 .In order to economically harvest this immense energy wealth it is essential that the effects of a progressive global warming are kept under control, curbing both the emissions

  • f NG (CH4) and of CO2.
  • Leaks of NG should be kept under strict control.
  • However the ordinary combustion of NG is inevitably

emitting CO2, although roughly at one half of what compared to Coal.  The CO2 production could however be avoided with a alternative decomposition – at sufficiently high temperatures CH4 -> 2H2+C (hydrogen gas + solid black carbon)  This promising process is under active investigation.

Teatro_Trieste_Popular Slide# : 39

slide-40
SLIDE 40

Teatro_Trieste_Popular Slide# : 40

Comparing reforming and pyrolysis of NG for H2 production

Reforming and CO2 sequestration Spontaneous pyrolisis without CO2 emissions Carbon structure 3 µm

slide-41
SLIDE 41

Conclusion: a new age of Abundance

 One of the best available solutions to meet the rising demand in energy lies in the ability to economically develop unconventional gas resources, initially  (1) coalbed methane and shale gas and later the future  (2) methane hydrates.  North America, India, China, Africa and Latin America will all have access to cheap and abundant shale gas and

  • il.

 With both environmental sensitivities and gas consumption on the rise, the question is how to recover these huge resources and to economically harvest this immense energy wealth in the most efficient and cost effective matter and with a minimal environmental foot print.

Teatro_Trieste_Popular Slide# : 41

slide-42
SLIDE 42

The European Union has to decide between CHEAP and EXPENSIVE energy

Teatro_Trieste_Popular Slide# : 42

slide-43
SLIDE 43

Teatro_Trieste_Popular Slide# : 43