
SLIDE 1
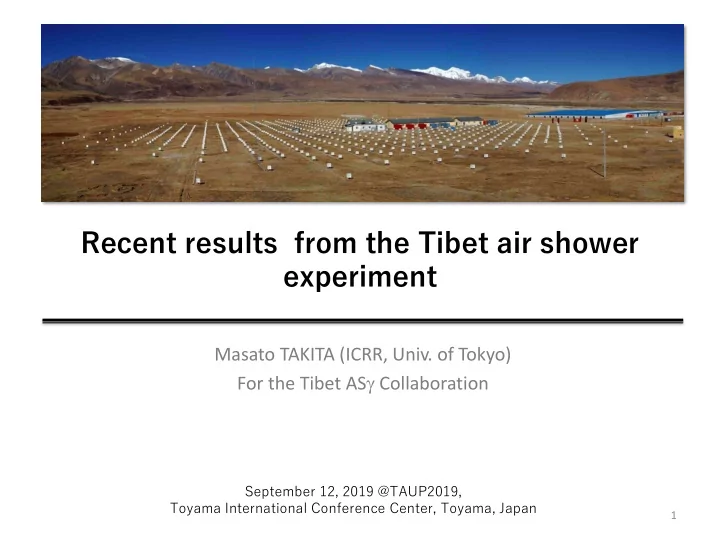
Masato TAKITA (ICRR, Univ. of Tokyo) For the Tibet ASg Collaboration
1
Recent results from the Tibet air shower experiment
September 12, 2019 @TAUP2019, Toyama International Conference Center, Toyama, Japan
Recent results from the Tibet air shower experiment Masato TAKITA - - PowerPoint PPT Presentation
Recent results from the Tibet air shower experiment Masato TAKITA (ICRR, Univ. of Tokyo) For the Tibet AS g Collaboration September 12, 2019 @TAUP2019, Toyama International Conference Center, Toyama, Japan 1 2 Outline Tibet AS g
Masato TAKITA (ICRR, Univ. of Tokyo) For the Tibet ASg Collaboration
1
September 12, 2019 @TAUP2019, Toyama International Conference Center, Toyama, Japan
2
3
4
Received April 4, 2019, accepted June 13, published July 29, 2019 in PRL
5
Site: Tibet (90.522oE, 30.102oN) 4,300 m a.s.l. Present Performance # of detectors 0.5 m2 x 597 Effective area ~65,700 m2 Angular resolution ~0.5°@10TeV ~0.2°@100TeV Energy resolution ~40%@10TeV g ~20%@100TeV g →Observation of secondary (mainly e+/-,γ) in AS Primary energy : 2nd particle densities Primary direction : 2nd relative timings
Measurement of # of m in AS → g/CR discrimination DATA: February, 2014 - May, 2017 Live time: 719 days
✓ 2.4m underground (~515g/cm2 ~19X0) ✓ 4 pools, 16 units / pool ✓ 7.35m×7.35m×1.5m deep (water) ✓ 20”ΦPMT (HAMAMATSU R3600) ✓ Concrete pools + white Tyvek sheets
Soil & Rocks 2.6m Waterproof & reflective materials Reinforced concrete
e g m
1.0m
PMT
7.3m
Water 1.5m Cherenkov lights
20 inch
Air 0.9m
Basic idea: T. K. Sako et al., Astropart. Phys. 32, 177 (2009)
6
’
Electron・Positron・Muon ground ground Electron・Positron・Muon
Simulated by COSMOS
7
’
’
8
100TeV 10TeV
AS size log(Sr) by AS # of muons log(SNm) by MD
Sampling AS size(Sr)
After Nm cut,~99.9% CR rejection & ~90% g efficiency @100 TeV SNm=0 SNm=0
Gamma: MC sample(Crab orbit & Crab Flux) CR:DATA(excluding Crab and Galctic plane)
AS size log(Sr) by AS # of muons log(SNm) by MD
Amenomori et al., PRL (2019)
’
Sr (from AS array) : 3256 SNm (MD) : 2.3 zenith angle : 29.8° Erec : 251 TeV
+46
circle size ∝ log(# of detected particles) circle color ∝ relative timing [ns] fitting with NKG function ➡️ Erec (S50, q) lateral distribution S50
9
Amenomori et al., PRL (2019)
S50 improves E resolutions (10 - 1000 TeV) → ~40%@10 TeV , ~20%@100 TeV
10
AS size log(Sr) by AS # of muons log(SNm) by MD
SNm=0 SNm=0
AS size log(Sr) by AS # of muons log(SNm) by MD
Observed # of muons # of muons at the cut value
>100 TeV from the Crab CR BG g MC Amenomori et al., PRL (2019) Amenomori et al., PRL Supplemental Material (2019) ’
11
Amenomori et al., PRL Supplemental Material (2019) ’
12
Thick curve: the expected fmux by the inverse Compton model normalized to HEGRA data Aharonian+, ApJ, 614, 897 (2004)
Amenomori et al., PRL (2019)
’
13
Thick curve: the expected flux by the inverse Compton model normalized to HEGRA data Aharonian+, ApJ, 614, 897 (2004)
’
’
14
✓ Tibet emission centroid coincident with molecular cloud indicated by CO emission contours ※consistent with VERITAS ✓ spectrum under analysis
15
𝟏 ° 𝟔 𝟏 ° × ×
𝜹
𝝉
𝜾𝟐
s Th the nu ev dis the fr Gem the
was 𝝉 𝟑 𝟒° 𝒆 𝒆 𝑶𝒕 𝒆 𝜽 𝒆 𝑶𝒕 𝒆 𝑶𝒄𝒉 𝒆 ± 𝟗°×± 𝟗°
× × ”Φ
Smoothed by 3-deg radius circle
Katayose ICRC2019 #770 ’
16
Pulsar contribution
’
17
γ ific
d s defin e n μ
α ± δ ± ν − first ν ̇ − − × − ν ̈ − × − α ± δ ± ν − first ν ̇ − ν ̈ − α ± δ ± ν − first ν ̇ − × − ν ̈ −
90.522˚E, 30.102˚N, 4300 m a.s.l.) (2) Angular Resolution ~ 0.9˚ (> 3 TeV) d flo γ nfig 133–6
Fermi-LAT, Ref. [3] Fermi-LAT, Ref. [2]
ay flu ific
Background Counts 50 60 70 80 90 100 110 Pulsar Phase 0.2 0.4 0.6 0.8 1.0 1.2 1.4 1.6 1.8 2.0 J1907+0602Tibet
Background Counts 70 80 90 100 110 120 130 Pulsar Phase 0.2 0.4 0.6 0.8 1.0 1.2 1.4 1.6 1.8 2.0 GemingaTibet
(b) (b) (b)
Tibet
Background Counts (>10 TeV) 100 120 140 160 180 200 Pulsar Phase 0.2 0.4 0.6 0.8 1.0 1.2 1.4 1.6 1.8 2.0 Crab PulsarPreliminary Preliminary Preliminary
MAGIC, Ref. [5]
Hibino ICRC2019 #695 ’
– Gamma-ray astronomy from TeV to sub-PeV → Crab: First detection of g rays > 100 TeV observed (5.6s) Highest energy photon ever observed: 450 TeV Opened a new energy window in astronomy, ie, sub-PeV gamma ray astronomy! Other interesting sources under study! Skipped in this talk are: – Sun shadow observation to probe solar MFs – Cosmic-ray anisotropy measurement – Chemical composition study around Knee – Hadronic interaction tests using air shower data
18
’