
SLIDE 1
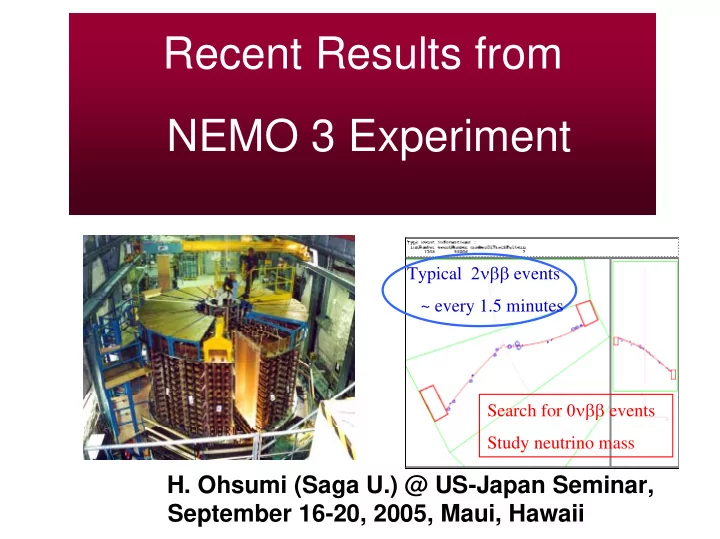
Recent Results from NEMO 3 Experiment
Typical 2νββ events ~ every 1.5 minutes Search for 0νββ events Study neutrino mass
- H. Ohsumi (Saga U.) @ US-Japan Seminar,
Recent Results from NEMO 3 Experiment Typical 2 events ~ every 1.5 - - PowerPoint PPT Presentation
Recent Results from NEMO 3 Experiment Typical 2 events ~ every 1.5 minutes Search for 0 events Study neutrino mass H. Ohsumi (Saga U.) @ US-Japan Seminar, September 16-20, 2005, Maui, Hawaii NEMO3 Collaboration NEMO3 Collaboration
Typical 2νββ events ~ every 1.5 minutes Search for 0νββ events Study neutrino mass
CENBG, IN2P3-CNRS Bordeaux University, France Charles University, Praha, Czech Republic CTU, Praha, Czech Republic INEL, Idaho Falls, USA INR, Moscow, Russia IReS, IN2P3-CNRS Strasbourg University, France ITEP, Moscou, Russia JINR, Dubna, Russia Jyvaskyla University, Finland LAL, IN2P3-CNRS Paris-Sud University, France LSCE, CNRS Gif sur Yvette, France LPC, IN2P3-CNRS Caen University, France Manchester University, Great-Britain Mount Holyoke College, USA RRC kurchatov Institute, Moscow, Russia Saga university, Saga, Japon UCL, London, Great-Britain
Majorana ν and effective mass <mν> ? or new physics (SUSY) ?
100Mo(~7kg) , 82Se(~1kg) , 130Te , 116Cd, 96Zr , 48Ca , 150Nd
Tracking chamber+Calorimeter+B-field+Shields →
0νββ : 2n → 2p+2e- (∆L = 2 Process) (Beyond Standard Model) 2νββ : 2n → 2p+2e-+2ν (Standard Process)
Expected Expected values of values of < <m mν
ν>
> from from neutrinos oscillations neutrinos oscillations parameters parameters
Pascoli and Petcov, hep-ph/0310003 (best fit νatm + νsol ) Quasi-Degenerate (QD): <mν> > 50 meV Inverted Hierarchy (IH): 15 meV < <mν> < 50 meV Normal Hierarchy (NH): <mν> < 5 meV
Search Region of NEMO 3 (hep-ph/0503246 A.Strumia and F.Vissani)
Source: 10 kg of ββ isotopes
cylindrical, S = 20 m2, e ~ 60 mg/cm2
Tracking detector:
drift wire chamber operating in Geiger mode (6180 cells)
Gas: He + 4% ethyl alcohol + 1% Ar + 0.1% H2O
Calorimeter:
1940 plastic scintillators coupled to low radioactivity PMTs
Magnetic field: 25 Gauss Gamma shield: Pure Iron (e = 18cm) Neutron shield:
30 cm water (ext. wall) 40 cm wood (top and bottom) (since march 2004: water + boron)
Fréjus Underground Laboratory : 4800 m.w.e.
AUGUST 2001
Cathodic rings Wire chamber
207Bi 90Sr
2e– (IC) lines ~0.5 ,~1 MeV
Calibration Source
Calibration tube ββ isotope foils
60Co
How detect signals and tag the background ?
∆t ~ 0 ns ∆t ≥ 3 ns ∆t ~0 ns ∆t ~ 0 ns
β- β-
e- e- e+ or e- γ γ
β- e-
« Crossing e- »
β- β-
Internal background External background
Source contaminations
γ α
source foil
ββ(2ν) decay ββ(0ν) decay
e+e pairs- Double Compton Compton + Möller
∆t ~0 ns
Signal Tracking (Identification e/others) Delayed (<700µs) α track Calorimeter ε(γ)~50% (@0.5MeV) Possible for tagging eγ, eγγ, eγγγ, … Time of flight σt~300ps(@1MeV) External Background rejection Magnetic Field (Identification e-/e+) 3~5% e-/e+ confusion @ 1~7MeV Identification of e, γ, α
B=25G
214Bi Tagged by e(γ)α (~164µs) ( 214Bi->214Po->210Pb) 208Tl eγ, eγγ, eγγγ, with γ (2.6MeV)
( 212Bi->212Po->208Pb) Neutron Crossing e (4~8MeV) Study of Background Process
12 00 01 02 03 04 05 06 07 08 09 10 11 19 17 18 16 15 14 13
48Ca
7.0 g
Qββ = 4272 keV
ββ2ν measurement
116Cd 405 g Qββ = 2805 keV 96Zr
9.4 g
Qββ = 3350 keV 150Nd 37.0 g Qββ = 3367 keV 130Te
454 g
Qββ = 2529 keV
External bkg measurement
100Mo 6.914 kg
Qββ = 3034 keV natTe
491 g
82Se
0.932 kg
Qββ = 2995 keV
Cu
621 g
(All the enriched isotopes produced in Russia)
NEMO-3 Opening Day, July 2002
Start taking data 14 February 2003
Drift distance
100Mo foil 100Mo foil
Transverse view Longitudinal view
Run Number: 2040 Event Number: 9732 Date: 2003-03-20
Geiger plasma longitudinal propagation Scintillator + PMT
Deposited energy: E1+E2= 2088 keV Internal hypothesis: (∆t)mes –(∆t)theo = 0.22 ns Common vertex: (∆vertex)⊥ = 2.1 mm
Vertex emissi
(∆vertex)// = 5.7mm
Vertex emissi
Transverse view Longitudi nal view
Run Number: 2040 Event Number: 9732 Date: 2003-03-20
Criteria to select ββ events:
Typical ββ2ν event observed from 100Mo Trigger:
1 PMT > 150 keV 3 Geiger hits (2 neighbour layers + 1) Trigger rate = 7 Hz ββ events: 1 event every 1.5 minutes
Electron crossing > 4 MeV Neutron capture Electron + α delay track (164 µs) 214Bi → 214Po → 210Pb Electron – positron pair B rejection →
Electron + N γ’s 208Tl (Eγ = 2.6 MeV)
Tracking Detector:
99.5 % Geiger cells ON Vertex resolution: 2 e− channels (482 and 976 keV) using 207Bi sources at 3 well known positions in each sector σ⊥ (∆Vertex) = 0.6 cm σ// (∆Vertex) = 1.3 cm (Z=0) e+/e− separation with a magnetic field of 25 G ~ 3% confusion at 1 MeV
β
x ∆Vertex = distance between the two vertex
Time Of Flight:
Time Resolution (ββ channel) ≈ 250 ps at 1 MeV ToF (external crossing e− ) > 3 ns external crossing e− totaly rejected
External Background ββ events from the foil
( ∆ tmes – ∆ tcalc ) e x t e r n a l h y p
( n s ) (∆tmes – ∆tcalc) internal hypo. (ns)
207Bi
2 conversion e− 482 keV and 976 keV 482 keV 976 keV
FWHM = 135 keV (13.8%) Calorimeter: 97% of the PMTs+scintillators are ON Energy Resolution: calibration runs (every ~ 40 days) with 207Bi sources
17% 14%
FWHM (1 MeV)
Int.Wall 3" PMTs
5" PMTs
Daily Laser Survey to control gain stability of each PM
Expected Performance of the detector has been reached
100Mo 2β2ν preliminary results
(Data Feb. 2003 – Dec. 2004)
Cos(θ) Angular Distribution
219 000 events 6914 g 389 days S/B = 40 NEMO-3
100Mo
E1 + E2 (keV) Sum Energy Spectrum
219 000 events 6914 g 389 days S/B = 40 NEMO-3
100Mo
Background subtracted
2β2ν Monte Carlo
2β2ν Monte Carlo Background subtracted
T1/2 = 7.11 ± 0.02 (stat) ± 0.54 (syst) × 1018 y
7.37 kg.y
82Se 116Cd 150Nd 96Zr
Data
ββ2ν simulation
Data
ββ2ν simulation
Data
ββ2ν simulation
NEMO-3 932 g 389 days 2750 events S/B = 4 NEMO-3 NEMO-3 NEMO-3 5.3 g 168.4 days 72 events S/B = 0.9 37 g 168.4 days 449 events S/B = 2.8 405 g 168.4 days 1371 events S/B = 7.5
E1+E2 (keV) E1+E2 (MeV) E1+E2 (MeV) E1+E2 (MeV)
Background subtracted
2β2ν Monte Carlo
82Se
T1/2 = 9.6 ± 0.3 (stat) ± 1.0 (syst) × 1019 y
116Cd
T1/2 = 2.8 ± 0.1 (stat) ± 0.3 (syst) × 1019 y
150Nd T1/2 = 9.7 ± 0.7 (stat) ± 1.0 (syst) × 1018 y 96Zr
T1/2 = 2.0 ± 0.3 (stat) ± 0.2 (syst) × 1019 y
Background subtracted
MO100, EE-int, Emin ENRGY RAW-BGR spectrum and MTCA 2b2n 25 50 75 100 125 150 175 200 250 500 750 1000 1250 1500 1750 2000 E single, keV Events / 24 keV
Simkovic,
Single electron spectrum different between SSD and HSD 2β2ν HSD Monte Carlo
HSD
higher levels
Background subtracted
MO100, EE-int, Emin ENRGY RAW-BGR spectrum and MTCA 2b2n 25 50 75 100 125 150 175 200 250 500 750 1000 1250 1500 1750 2000 E single, keV Events / 24 keV
2β2ν SSD Monte Carlo Background subtracted
SSD
Single State
HSD: T1/2 = 8.61 ± 0.02 (stat) ± 0.60 (syst) × 1018 y SSD: T1/2 = 7.72 ± 0.02 (stat) ± 0.54 (syst) × 1018 y
100Mo 2β2ν single energy distribution
in favour of Single State Dominant (SSD) decay 4.57 kg.y
E1 + E2 > 2 MeV
4.57 kg.y
E1 + E2 > 2 MeV
HSD, higher levels
contribute to the decay
SSD, 1+ level
dominates in the decay
(Abad et al., 1984,
100Mo
0+
100Tc
1+
χ2/ndf = 139. / 36 χ2/ndf = 40.7 / 36 NEMO-3 NEMO-3
Esingle (keV) Esingle (keV)
Esingle (keV)
100 100Mo 2
Phase 1 (Feb. 2003 – Sept. 2004: 1.08 y of data) with radon bkg (limits @ 90% CL)
2 4 6 8 10 12 14 2.4 2.5 2.6 2.7 2.8 2.9 3 3.1 3.2
E2e (MeV) Number of events / 0.1 MeV
Data Radon simulation
Cu+natTe+130Te
In agreement with only Radon bkg expected
100Mo
Previous limits: T1/2(ββ0ν) > 5.5 1022 y
Ejiri et al. (2001)
100Mo (6.914 kg)
T1/2(ββ0ν) > 4.6 1023 y 〈mν〉 < 0.66 – 2.81 eV
5 10 15 20 25 30 2.6 2.7 2.8 2.9 3 3.1 3.2
E2e (MeV) Number of events / 0.04 MeV
ββ0ν (arbitrary units)
Data Radon simulation 2β2ν simulation
[2.8-3.2] MeV: ε(ββ0ν) = 8 % Expected bkg = 8.1 ± 1.3 Nobserved = 7 events
Nuclear Matrice Elements Ref: Simkovic (1999), Stoica (2001), Suhonen (1998,2003), Rodin (2005), Caurier (1996)
Previous limits: T1/2(ββ0ν) > 9.5 1021 y
Arnold et al. (1992)
82Se (0.932 kg)
T1/2(ββ0ν) > 1.0 1023 y 〈mν〉 < 1.75 – 4.86 eV
2 4 6 8 10 12 2.4 2.5 2.6 2.7 2.8 2.9 3 3.1 3.2
E2e (MeV) Number of events / 0.1 MeV
ββ0ν (arbitrary units)
Data Radon simulation 2β2ν simulation
[2.7-3.2] MeV: ε(ββ0ν) = 13 % Expected bkg = 3.1 ± 0.6 Nobserved = 5 events
82Se
NEMO-3 can measure each component of its background !
External Background 208Tl (PMTs) Measured with (e−, γ) external events ~ 10−3 ββ0ν-like events year−1 kg −1 with 2.8<E1+ E2<3.2 MeV 100Mo ββ2ν decay
T1/2 = 7.7 1018 y (SSD)
~ 0.3 ββ0ν-like events year−1 kg −1 with 2.8<E1+E2<3.2 MeV
92 ± 18 400 ±100
82Se
~ 0.1 ββ0ν-like events year−1 kg −1 with 2.8<E1+ E2<3.2 MeV
316 ± 46 sources
208Tl impurities inside the foils Measured with (e−,2γ), (e−,3γ) events coming from the foil
100Mo
metal. A (µBq/k) from(e−,Nγ) < 100 115 ± 13
100Mocomp.
A (µBq/k) HPGe meas.
In agreement with HPGe measurements
External Neutrons and High Energy gamma Measured with (e−,e−)int events with E1+E2 > 4 MeV < 0.02 ββ0ν-like events year−1 kg −1 with 2.8<E1+ E2<3.2 MeV ~
Only 2 (e−,e−)int events with E1+E2 > 4 MeV
4253 keV (26 Mar. 2003) 6361 keV (8 Nov. 2003) In agreement with expected background
< 110
Phase 1 (Feb. 2003 – Sept. 2004: 1.08 y of data) with radon bkg (limits @ 90% CL)
Limit on Majoron
100Mo: T1/2 (ββ0νΜ) > 1.8 1022 y 82Se: T1/2 (ββ0νΜ) > 1.5 1022 y
gM < (5.3 – 8.5) 10−5 (best limit) gM < (0.7 – 1.6) 10−4
Simkovic (1999), Stoica (1999) Simkovic (1999), Stoica (2001)
Limit on V+A
100Mo: T1/2 (ββ0ν V+Α) > 2.3 1023 y 82Se: T1/2 (ββ0ν V+Α) > 1.0 1023 y
λ < (1.5 – 2.0) 10−6 λ < 3.2 10−6
Tomoda (1991), Suhonen (1994) Tomoda (1991)
E1+E2= 2880 keV
Run 2220, event 136.604, May 11th 2003
α track (delay = 70 µs)
214Po → 210Pb 214Bi → 214Po
β decay IN THE GAS
Radon in the NEMO-3 gas of the wire chamber
Due to a tiny diffusion of the radon of the laboratory inside the detector A(Radon) in the lab ~15 Bq/m3
222Rn (3.8 days) 218Po 214Pb 214Bi 214Po 210Pb
β α
164 µs
Two independant measurements of radon in NEMO-3 gas Good agreement between the two measurements
Radon detector at the input/output of the NEMO-3 gas
~ 20 counts/day for 20 mBq/ m3
(1e− + 1 α) channel in the NEMO-3 data:
Delayed tracks (<700 µs) to tag delayed α from 214Po
214Bi → 214Po (164 µs) → 210Pb
~ 200 counts/hour for 20 mBq/m3 A(Radon) in NEMO-3 ≈ 20-30 mBq/m3
Decay in gas
β−
delayed α
214Bi → 214Po (164 µs) → 210Pb β− α
~ 1 ββ0ν-like events/year/kg with 2.8 < E1+E2 < 3.2 MeV
Radon is the dominant background today for ββ0ν search in NEMO-3 !!!
May 2004 : Tent surrounding the detector
Starts running Oct. 4th 2004 in Modane Underground Lab. 1 ton charcoal @ -50oC, 7 bars Activity: A(222Rn) < 15 mBq/m3 !!! Flux: 125 m3/h a factor 1000
Background
External Background: negligible Internal Background:
208Tl : 60 µBq/kg for 100Mo
300 µBq/kg for 82Se
214Bi : < 300 µBq/kg
~ 0.1 count kg−1 y −1 with 2.8<E1+E2<3.2 MeV ββ2ν 100Μο: T1/2 = 7.14 1018 y ~ 0.3 count kg−1 y −1 with 2.8<E1+E2<3.2 MeV
in 2009 after 5 years of data 6914 g of 100Mo T1/2(ββ0ν) > 4 1024 y (90% C.L.) <mν> < 0.2 – 1.3 eV 932 g of 82Se T1/2(ββ0ν) > 8 .1023 y (90% C.L.) <mν> < 0.6 – 1.7 eV
Nuclear Matrice Elements Ref: Simkovic (1999), Stoica (2001), Suhonen (1998,2003), Rodin (2005), Caurier (1996)
Expected Expected values of values of < <m mν
ν>
> from from neutrinos oscillations neutrinos oscillations parameters parameters
Pascoli and Petcov, hep-ph/0310003 (best fit νatm + νsol ) Quasi-Degenerate (QD): <mν> > 50 meV Inverted Hierarchy (IH): 15 meV < <mν> < 50 meV Normal Hierarchy (NH): <mν> < 5 meV
From NEMO 3 to Super-NEMO Search Region of NEMO 3 (hep-ph/0503246 A.Strumia and F.Vissani)
Factor 100 on the ββ(0ν) period T1/2, reach few 1026 years Light Majorana neutrino exchange: <mν> ~50 meV
ν 2 / 1
> . . ε A
N : N : Avogadro Number kC.L. =1,6 à 90% C.L. A : Mass number t : measurement time (y)
ln2 . N kC.L.
(y)
Mass of isotope ββ (g) Background (y-1. g-1. keV-1) FWHM (keV) Detection efficiency
Mass ~100 kg
ε
Resolution
(FWHM): ~ 7 % at 3 MeV (will be dominated by source foil) instead of ~ 11 % at 3 MeV for NEMO 3 (dominated by calorimeter)
Efficiency improvement by a factor 2 Background
internal contaminations in 208Tl and 214Bi to be improved by a factor of 10
Plane geometry Source (40 mg/cm2) 12m2, tracking volume (~3000 channels) and calorimeter (~1000 PMT) Modular (~ 5 kg of enriched isotope/module) 5 m 1 m 100 kg: 20 modules ~ 60 000 channels for drift chamber ~ 20 000 PMT 4 m
1,5m 1,5m
Need of cavity of ~ 60m x 15m x15m Possible in Gran Sasso or in Modane if a new cavity