
SLIDE 1
NEMO 3 and SuperNEMO
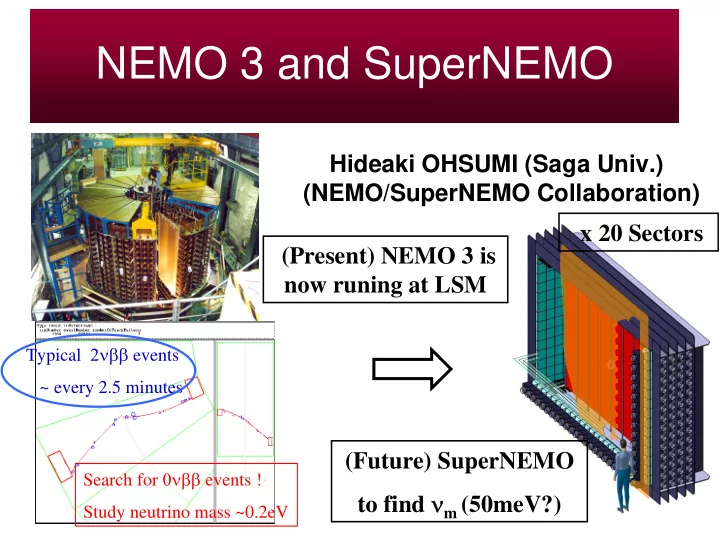
Hideaki OHSUMI (Saga Univ.) (NEMO/SuperNEMO Collaboration)
Typical 2νββ events ~ every 2.5 minutes Search for 0νββ events ! Study neutrino mass ~0.2eV
NEMO 3 and SuperNEMO Hideaki OHSUMI (Saga Univ.) (NEMO/SuperNEMO - - PowerPoint PPT Presentation
NEMO 3 and SuperNEMO Hideaki OHSUMI (Saga Univ.) (NEMO/SuperNEMO Collaboration) x 20 Sectors (Present) NEMO 3 is now runing at LSM Typical 2 events ~ every 2.5 minutes (Future) SuperNEMO Search for 0 events ! to find m (50meV?)
Typical 2νββ events ~ every 2.5 minutes Search for 0νββ events ! Study neutrino mass ~0.2eV
Majorana ν and effective mass <mν> ? or new physics (SUSY) ?
100Mo(~7kg) , 82Se(~1kg) , 130Te , 116Cd, 96Zr , 48Ca , 150Nd (no 76Ge, 136Xe)
Tracking chamber+Calorimeter+B-field+Shields
→
0νββ : 2n → 2p+2e- (ΔL = 2 Process) (Beyond Standard Model) 2νββ : 2n → 2p+2e-+2ν (Standard Process)
Source: 10 kg of ββ isotopes
cylindrical, S = 20 m2, e ~ 60 mg/cm2
Tracking detector:
drift wire chamber operating in Geiger mode (6180 cells)
Gas: He + 4% ethyl alcohol + 1% Ar + 0.1% H2O
Calorimeter:
1940 plastic scintillators coupled to low radioactivity PMTs
Magnetic field: 25 Gauss Gamma shield: Pure Iron (e = 18cm) Neutron shield:
30 cm water (ext. wall) 40 cm wood (top and bottom) (since march 2004: water + boron)
Fréjus Underground Laboratory : 4800 m.w.e.
ββ isotope foils
Calibration tube Cathodic rings Wire chamber
207Bi 90Sr 60Co
2e– (IC) lines ~0.5 ,~1 MeV
Calibration Source
100Mo 6.914 kg
Qββ = 3034 keV
12 00 01 02 03 04 05 06 07 08 09 10 11 19 17 18 16 15 14 13
82Se
0.932 kg
Qββ = 2995 keV 116Cd 405 g Qββ = 2805 keV 96Zr
9.4 g
Qββ = 3350 keV 150Nd 37.0 g Qββ = 3367 keV
Cu
621 g
48Ca
7.0 g
Qββ = 4272 keV natTe
491 g
130Te
454 g
Qββ = 2529 keV
ββ2ν measurement
External bkg measurement
(All the enriched isotopes produced in Russia)
Δt ~ 0 ns Δt ≥ 3 ns Δt ~0 ns Δt ~ 0 ns
β- β-
e- e- e+ or e- γ γ
β- e-
« Crossing e- » e+e pairs- Double Compton Compton + Möller
β- β-
Δt ~0 ns
Signal Internal background External background
Source contaminations
γ α
source foil
How detect signals and tag the background ?
Tracking (Identification e/others) Delayed (<700μs) α track Calorimeter ε(γ)~50% (@0.5MeV) Possible for tagging eγ, eγγ, eγγγ, … Time of flight σt~300ps(@1MeV) External Background rejection Magnetic Field (Identification e-/e+) 3~5% e-/e+ confusion @ 1~7MeV 214Bi Tagged by e(γ)α (~164μs) ( 214Bi->214Po->210Pb) 208Tl eγ, eγγ, eγγγ, with γ (2.6MeV)
( 212Bi->212Po->208Pb) Neutron Crossing e (4~8MeV) Study of Background Process Identification of e, γ, α
B=25G
ββ(2ν) decay ββ(0ν) decay
Electron + N γ’s 208Tl (Eγ = 2.6 MeV) Electron crossing > 4 MeV Neutron capture Electron + α delay track (164 μs) 214Bi → 214Po → 210Pb Electron – positron pair B rejection →
100Mo foil 100Mo foil
Transverse view Longitudinal view
Run Number: 2040 Event Number: 9732 Date: 2003-03-20
Geiger plasma longitudinal propagation Scintillator + PMT
Deposited energy: E1+E2= 2088 keV Internal hypothesis: (Δt)mes –(Δt)theo = 0.22 ns Common vertex: (Δvertex)⊥ = 2.1 mm
Vertex emission
(Δvertex)// = 5.7 mm
Vertex emission
Transverse view Longitudinal view
Run Number: 2040 Event Number: 9732 Date: 2003-03-20
Criteria to select ββ events:
Trigger:
at least 1 PMT > 150 keV ≥ 3 Geiger hits (2 neighbour layers + 1) Trigger rate = 7 Hz ββ events: 1 event every 2.5 minutes
Typical ββ2ν event observed from 100Mo
(Data Feb. 2003 – Dec. 2004) (Phase I)
T1/2 = 7.11 ± 0.02 (stat) ± 0.54 (syst) × 1018 y
Phys Rev Lett 95, 182302 (2005)
100Mo 2β2ν preliminary results 7.37 kg.y
Cos(θ) Angular Distribution
219 000 events 6914 g 389 days S/B = 40 NEMO-3
100Mo
E1 + E2 (keV) Sum Energy Spectrum
219 000 events 6914 g 389 days S/B = 40 NEMO-3
100Mo
Background subtracted
2β2ν Monte Carlo
2β2ν Monte Carlo Background subtracted
No Significant discrepancy 2νββ is really standard process!
Background subtracted
82Se
T1/2 = 9.6 ± 0.3 (stat) ± 1.0 (syst) × 1019 y
116Cd
T1/2 = 2.8 ± 0.1 (stat) ± 0.3 (syst) × 1019 y
150Nd T1/2 = 9.7 ± 0.7 (stat) ± 1.0 (syst) × 1018 y 96Zr
T1/2 = 2.0 ± 0.3 (stat) ± 0.2 (syst) × 1019 y 82Se 116Cd 150Nd
96Zr
Data
ββ2ν simulation
Data
ββ2ν simulation
Data
ββ2ν simulation
NEMO-3 932 g 389 days 2750 events S/B = 4 NEMO-3 NEMO-3 NEMO-3 5.3 g 168.4 days 72 events S/B = 0.9 37 g 168.4 days 449 events S/B = 2.8 405 g 168.4 days 1371 events S/B = 7.5
E1+E2 (keV) E1+E2 (MeV) E1+E2 (MeV) E1+E2 (MeV)
Background subtracted
2β2ν Monte Carlo
ESUM (MeV) (48Ca-foil)
50 100 150 200 250 300 0.5 1 1.5 2 2.5 3 3.5 4 4.5 5
Esmall > 0.7 MeV cos(θ)<0.0 Esmall > 0.2 MeV
7g of 48Ca enough radio pure after chemistry 214Bi, 208Tl but 30m Bq of 90Sr! to remove Möller scattering pure beta emitter (90Y) (1) ESUM>2.MeV or (2) Eth > 0.7 MeV cosθ < 0 back to back
1.07y
48 48Ca analysis 1st preliminary result
T1/2 = [3.9±0.7(stat)±0.6(syst)]·1019 y
ESUM (MeV) (48Ca-foil,ESmall>0.7 MeV, cos(θ)<0.0 )
2 4 6 8 10 12 14 16 18 20 0.5 1 1.5 2 2.5 3 3.5 4 4.5 5
T1/2 = 7.11 ± 0.02 (stat) ± 0.54 (syst) × 1018 y
SSD model confirmed
HSD, higher levels
contribute to the decay
SSD, 1+ level
dominates in the decay
(Abad et al., 1984,
100Mo
0+
100Tc
1+
Simkovic,
Single electron spectrum different between SSD and HSD
Esingle (keV)
SSD simulation
Decay to the excited 0+ state (1130keV) of 100Ru T1/2 = 5.7+1.3
Nuclear Physics A781 (2006) 209-226.
Radon in the NEMO-3 gas of the wire chamber
Due to a tiny diffusion of the radon of the laboratory inside the detector A(Radon) in the lab ~15 Bq/m3
222Rn (3.8 days) 218Po 214Pb 214Bi 214Po 210Pb
β α
164 μs
~ 1 ββ0ν-like events/year/kg with 2.8 < E1+E2 < 3.2 MeV
Radon is the dominant background at Phase 1 for ββ0ν search in NEMO-3 !!! Two independant measurements of radon in NEMO-3 gas Good agreement between the two measurements
Radon detector at the input/output of the NEMO-3 gas
~ 20 counts/day for 20 mBq/ m3
(1e− + 1 α) channel in the NEMO-3 data:
Delayed tracks (<700 μs) to tag delayed α from 214Po
214Bi → 214Po (164 μs) → 210Pb
~ 200 counts/hour for 20 mBq/m3 A(Radon) in NEMO-3 ≈ 20-30 mBq/m3
Decay in gas
β−
delayed α
214Bi → 214Po (164 μs) → 210Pb β− α
Starts running Oct. 4th 2004 in Modane Underground Lab. 1 ton charcoal @ -50oC, 7 bars Activity: A(222Rn) < 15 mBq/m3 !!! Flux: 125 m3/h a factor 1000
May 2004 : Tent surrounding the detector Phase I Phase II
T1/2(ββ0ν) > 2 x 1024 (90 % CL) <mν> < 0.3 – 1.3 eV expected in 2009 T1/2(ββ0ν) > 5.8 x 10²³ (90 % CL) <mν> < 0.6 – 2.4 eV Phases I + II (preliminary) Phase I, High radon 394 days Phase I + II 693 days
[2.8-3.2] MeV: ε(ββ0ν) = 8 % Expected bkg = 8.1 events Nobserved = 7 events
Number of events / 40 keV
Phase II, Low radon 299 days
[2.8-3.2] MeV: ε(ββ0ν) = 8 % Expected bkg = 3.0 events Nobserved = 4 events
Number of events / 40 keV Number of events / 40 keV
NEMO 3 NEMO 3 NEMO 3
Background
External Background: negligible Internal Background:
208Tl : 60 μBq/kg for 100Mo
300 μBq/kg for 82Se
214Bi : < 300 μBq/kg
~ 0.1 count kg−1 y −1 with 2.8<E1+E2<3.2 MeV ββ2ν 100Μο: T1/2 = 7.11 1018 y ~ 0.3 count kg−1 y −1 with 2.8<E1+E2<3.2 MeV
in 2009 after 5 years of data 6914 g of 100Mo T1/2(ββ0ν) > 2 1024 y (90% C.L.) <mν> < 0.3 – 1.3 eV 932 g of 82Se T1/2(ββ0ν) > 8 .1023 y (90% C.L.) <mν> < 0.6 – 1.7 eV
Nuclear Matrice Elements Ref: Simkovic (1999), Stoica (2001), Suhonen (1998,2003), Rodin (2005), Caurier (1996)
Nuclei Enriched Source in NEMO 3 T1/2, y (NEMO 3) (partially preliminary)
48Ca (4.271 MeV) (0.187%)
7.0 g 3.9(+/-0.7+/-0.6)⋅1019
116Cd (2.802 MeV) (7.5%)
405 g 2.8(+/-0.1+/-0.3)⋅1019
130Te (2.528 MeV) (33.8%)
454 g Please wait ….
76Ge (2.040 MeV) (7.8%) 82Se (2.995 MeV) (9.2%)
932 g 9.6(+/-0.3+/-1.0)⋅1019
96Zr (3.350 MeV) (2.8%)
9.4 g 2.0(+/-0.3+/-0.2)⋅1019
100Mo (3.034 MeV) (9.6%)
6914 g 7.11(+/-0.02+/-0.54)⋅1018
136Xe (2.479 MeV) (8.9%) 150Nd (3.367 MeV) (5.6%)
37 g 9.7(+/-0.7+/-1.0)⋅1018
100Mo to the excited 0+ (1.130 keV) T1/2 = 5.7(+1.3-0.9 +/- 0.8) ⋅1020 y
NEMO-3 SuperNEMO T1/2(ββ0ν) > ln2 × M × ε × Tobs Nexclu Navo A ×
7 kg 100 - 200 kg
Isotope mass M Efficiency ε ε(ββ0ν) = 8 % ε(ββ0ν) ~ 30 % Choice of isotope
100Mo T1/2(ββ2ν) = 7. 1018 y 150Nd or 82Se T1/2(ββ2ν) = 1020 y
ββ2ν ~ 2 evts / 7 kg / y
ββ(2ν)
ββ2ν ~ 1 evt / 100 kg/ y
Nexclu = f(BKG)
Internal contaminations
208Tl and 214Bi in the ββ foil 214Bi < 300 μBq/kg 208Tl < 20 μBq/kg 214Bi < 10 μBq/kg 208Tl < 2 μBq/kg
(208Tl, 214Bi) ~ 1 evt/ 100 kg /y (208Tl, 214Bi) ~ 1 evt/ 7 kg /y
IF
FWHM(calo)=8% @3MeV FWHM(calo)=4% @3MeV T1/2(ββ0ν) > 2. 1024 y <mν> < 0.3 – 1.3 eV T1/2(ββ0ν) > 1026 y <mν> < 50 meV SENSITIVITY
USA MHC INL (U Texas) Japan U Saga KEK U Osaka France CEN Bordeaux IReS Strasbourg LAL ORSAY LPC Caen LSCE Gif/Yvette UK UCL U Manchester Imperial College Finland U Jyvaskula Russia JINR Dubna ITEP Mosow Kurchatov Institute Ukraine INR Kiev ISMA Kharkov Czech Republic
Charles U Praha
IEAP Praha Marocco Fes U Slovakia (U. Bratislava)
~ 60 physicists, 12 countries, 27 laboratories
Spain U Valencia U Saragossa U Barcelona Poland U Warsaw
Top view
5 m 1 m
Planar and modular design: ~ 100 kg of enriched isotopes (20 modules × 5 kg)
1 module: Source (40 mg/cm2) 4 x 3 m2 Tracking : drift chamber ~3000 cells in Geiger mode Calorimeter: scintillators + PM ~1 000 PM if scint. blocks ~ 100 PM if scint. bars 4 m
source foils with 1uBq/kg sensitivity running in Canfranc underground laboratory (Spain)
R&D towards bigger block sizes and large production scale underway
(Similar proposal in Japan with MOON team …. See Nomachi’s talk)
Plastic scintillators (collaboration with Karkhov and Dubna = PICS)
Tests in CENBG of different production and size of scintillators with an e- spectrometer
FWHM @ 1 MeV ~ 7%
Scintillator blocks 6 x 6 x 2 cm3 PMT XP5312B (Photonis) Liquid scintillators
FWHM @ 1 MeV = 7.3 %
+ Light guide + PMT 3"
Photomultipliers
Chemical purification at INL (US)
Purification
Goal: 208Tl < 2 μBq/kg
214Bi < 10 μBq/kg
All funded by ILIAS(*) Collaboration with INL (chemical method)
Installation of NEMO3 foils (LSM)
Source foils production
Goal: 250 m2 of 82Se foils of 40 mg/cm2 NEMO3: ITEP (Moscow) powder + glue (60mg/cm2) =>Extrapolation 100 kg possible if very clean conditions
Or new technique in test in LAL
Enrichment
Goal: To be able to produce 100 kg of 82Se
Distillation of 116Cd tested with NEMO3
Facilities exist in Russia
ECP (Electro-Chemical Plant, Svetlana)
Zelenogorsk (Siberia) (Integrated Large Infrastructures for Astroparticle Science) : european network Laboratoires souterrains - Ondes gravitationnelles - Matière noire - Double bêta
(*) ILIAS
Collaboration with Kurchatov and Nijni-Novgorod Institutes (distillation)
today : NEMO HPGe 400 cm3 60 μBq/kg 208Tl and 200 μBq/kg 214Bi (1 month, 1 kg) Goal: Improve the sensitivity … ⇒ Development of 800 cm3 HPGe (Canberra-Eurysis) + Shields improvement + New ultra-pur cryostat ⇒ New planar Ge detector (σ=0.5 keV@40keV)
Ge detectors Radon detectors
Today : 1 mBq/m3 Volume: 70l Goal: 0,1 mBq/m3 ⇒ Development V=700 l (Japan) + Improvement of diodes radiopurety Other way of detection….(liquid scintillators) ?
Tracking (wire chamber) Shield radon, neutron,γ Source foil (40 mg/cm2) Scintillator + PMT
2 modules 2×3 m2 → 12 m2 Background < 1 event / month
β α
(164 μs)
β α
(300 ns)
232Th
212Bi
(60.5 mn)
208Tl
(3.1 mn)
212Po 208Pb
(stable) 36%
238U
214Bi
(19.9 mn)
210Tl
(1.3 mn)
214Po 210Pb
22.3 y
0.021%
Bi-Po Process Qβ (212Bi) = 2.2 MeV
e−
e− prompt
α
T1/2 ~ 300 ns Edeposited ~ 1 MeV Delay α
To measure the purity in 208Tl and 214Bi of the ββ source foils before the installation in SuperNEMO Goal: To measure 5 kg of foils (12 m2, 40 mg/cm2) in 1 month with a sensitivity of:
208Tl < 2 μBq/kg and 214Bi < 10 μBq/kg
MOON module with 20kg of source
See Nomachi’s (MOON) talk
Modane(Fr
ejus)
(France) Canfranc (Spain)
(2010) Prototype of BiPo
R&D SuperNEMO R&D SuperNEMO
NEMO3 Running NEMO3 Running
RUNNING of RUNNING of Full detector Full detector construction of construction of 20 modules 20 modules SuperNEMO 1 SuperNEMO 1st
st
module construction module construction Final SuperNEMO modules installation Final SuperNEMO modules installation Preparation Preparation
BiPo BiPo
installation installation BiPo1 BiPo1 Canfranc Canfranc
BiPo BiPo
construction construction
BiPo BiPo running @ Canfranc
running @ Canfranc 6 SuperNEMO modules running @ Canfranc 6 SuperNEMO modules running @ Canfranc
T T DR DR Cost estimate (preliminary) Isotope: (10 M€) if 82Se 20 M€ if 150Nd (AVLIS) Detector: 20 M€ Grand Total: 40 - 50 M€
Isotope Qββ (MeV) G0ν (y-1)
Shell Model 2.44 9.2 1026 7 1027 9.6 1026 3.6 1026 5.2 1026 0.24 1.08 2.24 1.75 1.89 1.70 1.81
QRPA
48Ca
4.271 2.9 1027
76Ge
2.040 2.4 1027
82Se
2.995 7.4 1026
96Zr
3.350 1.5 1028
100Mo
3.034 1.4 1027
116Cd
2.802 1027
130Te
2.528 1027
136Xe
2.479 2-5 1027 150Nd
T1/2(0ν) with mν=50meV
Shell Model: Caurier et al. QRPA: Feasller Rodin Simkovic Vogel 2005
2 0ν
SuperNEMO SNO++ DCBA etc.
150Nd
Continue …. Comments on Enrichment of 150Nd.