
SLIDE 1
Real Cost Measure by Neighborhood Clusters California: 31% N=265 - - PowerPoint PPT Presentation
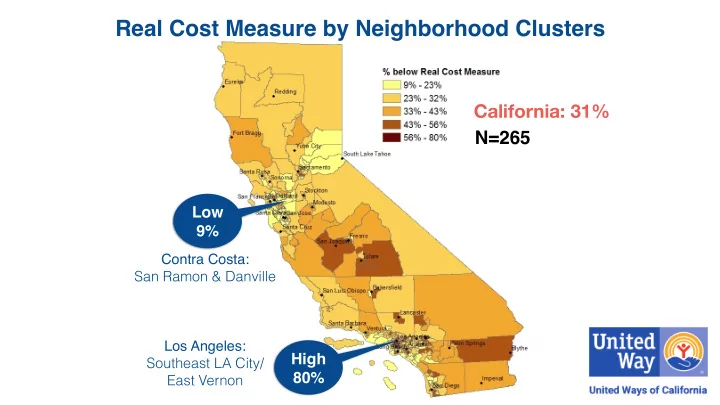
Real Cost Measure by Neighborhood Clusters California: 31% N=265 Low 9% Contra Costa: San Ramon & Danville Los Angeles: High Southeast LA City/ 80% East Vernon What it Takes a Household with 2 Adults, 1 Infant and 1