RBC Canadian Manufacturing PMI 50 = no change on previous month 60 - - PowerPoint PPT Presentation

rbc canadian manufacturing pmi
SMART_READER_LITE
LIVE PREVIEW

RBC Canadian Manufacturing PMI 50 = no change on previous month 60 - - PowerPoint PPT Presentation

Historical overview: RBC Canadian Manufacturing PMI 50 = no change on previous month 60 Increasing rate of growth 55 50 Increasing rate of contraction 45 Oct'10 Feb'11 Jun Oct Feb'12 Jun Sources: RBC, Markit. The intellectual


slide-1
SLIDE 1

The intellectual property rights to the RBC Canadian Manufacturing PMI provided herein is owned by Markit Economics Limited. Any unauthorised use, including but not limited to copying, distributing, transmitting or otherwise of any data appearing is not permitted without Markit’s prior consent. Markit shall not have any liability, duty or obligation for or relating to the content of information (“data”) contained herein, any errors, inaccuracies, omissions or delays in the data, or for any actions taken in reliance thereon. In no event shall Markit be liable for any special, incidental, or consequential damages, arising out of the use of the data. Purchasing Managers’ Index™ and PMI™ are trade marks of Markit Economics Limited, RBC use the above marks under licence.

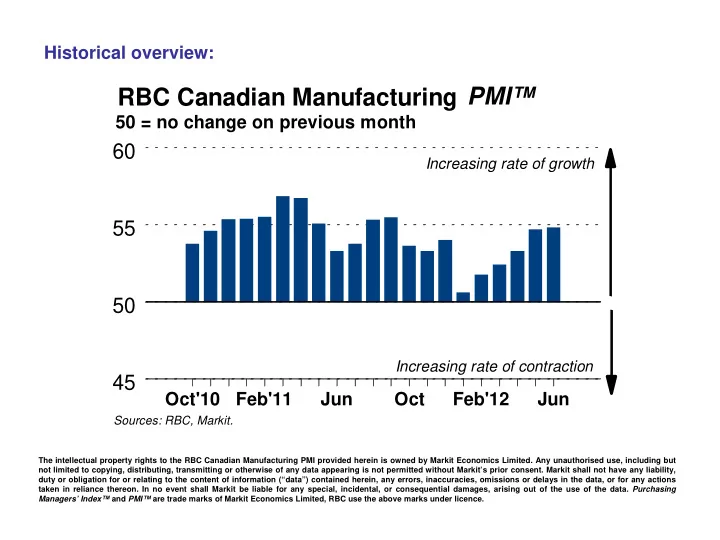
Historical overview: Oct'10 Feb'11 Jun Oct Feb'12 Jun

45 50 55 60

Increasing rate of contraction Increasing rate of growth

50 = no change on previous month

RBC Canadian Manufacturing PMI™

Sources: RBC, Markit.

slide-2
SLIDE 2

Summary of RBC Canadian Manufacturing PMI™ regional data:

Feb’12 Mar Apr May Jun Alberta and British Columbia PMI 53.4 51.7 51.3 53.1 53.7 Output Index 54.6 51.0 50.7 52.6 54.3 Ontario PMI 51.9 52.0 52.8 53.9 53.6 Output Index 52.6 51.6 51.8 53.9 53.7 Quebec PMI 48.6 52.4 55.9 58.0 57.3 Output Index 46.7 51.2 55.2 58.7 58.1 Rest of Canada PMI 52.2 54.6 54.9 55.2 55.6 Output Index 52.6 55.3 56.7 55.3 56.6

Unless otherwise indicated, any reading above 50.0 signals an increase or growth on the previous month, below 50.0 indicates a decrease or contraction. The greater the divergence from 50.0, the greater the rate of change signalled by the index.

The intellectual property rights to the RBC Canadian Manufacturing PMI provided herein is owned by Markit Economics Limited. Any unauthorised use, including but not limited to copying, distributing, transmitting or otherwise of any data appearing is not permitted without Markit’s prior consent. Markit shall not have any liability, duty or obligation for or relating to the content of information (“data”) contained herein, any errors, inaccuracies, omissions or delays in the data, or for any actions taken in reliance thereon. In no event shall Markit be liable for any special, incidental, or consequential damages, arising out of the use of the data. Purchasing Managers’ Index™ and PMI™ are trade marks of Markit Economics Limited, RBC use the above marks under licence.

slide-3
SLIDE 3

The intellectual property rights to the RBC Canadian Manufacturing PMI provided herein is owned by Markit Economics Limited. Any unauthorised use, including but not limited to copying, distributing, transmitting or otherwise of any data appearing is not permitted without Markit’s prior consent. Markit shall not have any liability, duty or obligation for or relating to the content of information (“data”) contained herein, any errors, inaccuracies, omissions or delays in the data, or for any actions taken in reliance thereon. In no event shall Markit be liable for any special, incidental, or consequential damages, arising out of the use of the data. Purchasing Managers’ Index™ and PMI™ are trade marks of Markit Economics Limited, RBC use the above marks under licence.

Company size analysis:

45 50 55 60 Oct'10 Feb'11 Jun Oct Feb'12 Jun

RBC PMI Small Medium Large Headline PMI Index, 50 = no change on previous month

Sources: RBC, Markit.

slide-4
SLIDE 4

The intellectual property rights to the RBC Canadian Manufacturing PMI provided herein is owned by Markit Economics Limited. Any unauthorised use, including but not limited to copying, distributing, transmitting or otherwise of any data appearing is not permitted without Markit’s prior consent. Markit shall not have any liability, duty or obligation for or relating to the content of information (“data”) contained herein, any errors, inaccuracies, omissions or delays in the data, or for any actions taken in reliance thereon. In no event shall Markit be liable for any special, incidental, or consequential damages, arising out of the use of the data. Purchasing Managers’ Index™ and PMI™ are trade marks of Markit Economics Limited, RBC use the above marks under licence.

Export analysis:

Sources: RBC, Markit.

45 50 55 60 65 Oct'10 Feb'11 Jun Oct Feb'12

Exporters' PMI Index, 50 = no change on previous month