
SLIDE 1
Page 1 26/10/2016
Implemented by
Rapid Loss Appraisal Tool (RLAT) for agribusiness value chains - - PowerPoint PPT Presentation
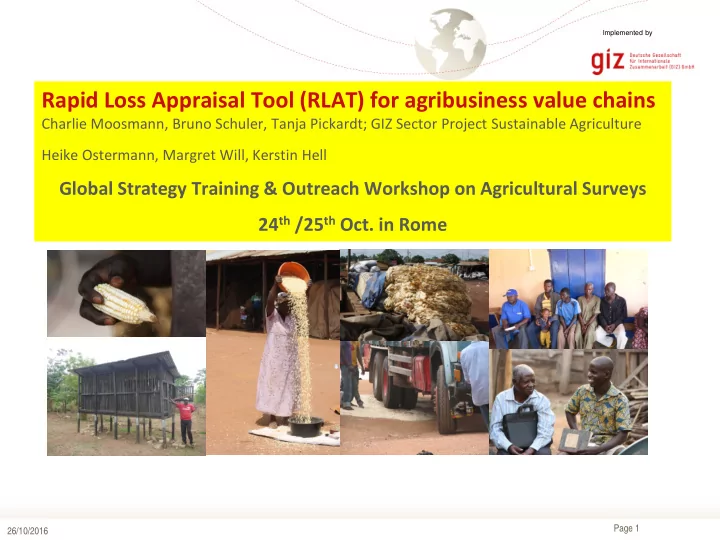
Implemented by Rapid Loss Appraisal Tool (RLAT) for agribusiness value chains Charlie Moosmann, Bruno Schuler, Tanja Pickardt; GIZ Sector Project Sustainable Agriculture Heike Ostermann, Margret Will, Kerstin Hell Global Strategy Training &
Page 1 26/10/2016
Implemented by
Page 2
26/10/2016
Page 3 26/10/2016
Page 4 26/10/2016
Page 5
26/10/2016
Page 6
26/10/2016
(Relevance: not important, one activity amongst others, most important activity)
transport/storage/processing/marketing?
1
(As a reminder for later more in-depth discussions, the interviewer ticks the likely loss category.) Are quality issues an important loss factor? No ; Negligible ; Concern ; Intolerable ; Total loss
Page 7
26/10/2016
Page 8 XXX 26/10/2016 SNRD Conference Addis Ababa, Ethiopia, March 15-20 2015
WG AGRIBUSINESS & FOOD SECURITY
Sector Network Rural Development, Africa
Page 9 26/10/2016
Page 10
26/10/2016
Page 11
26/10/2016
Page 12
26/10/2016
Page 13
26/10/2016
Page 14
26/10/2016
Page 15
26/10/2016
Page 16
26/10/2016
Donor Platform - Rapid Loss Appraisal Tool (RLAT) See also library on post-harvest publications: https://www.donorplatform.org/postharvest- losses-and-food-waste/on-common-ground