
SLIDE 1
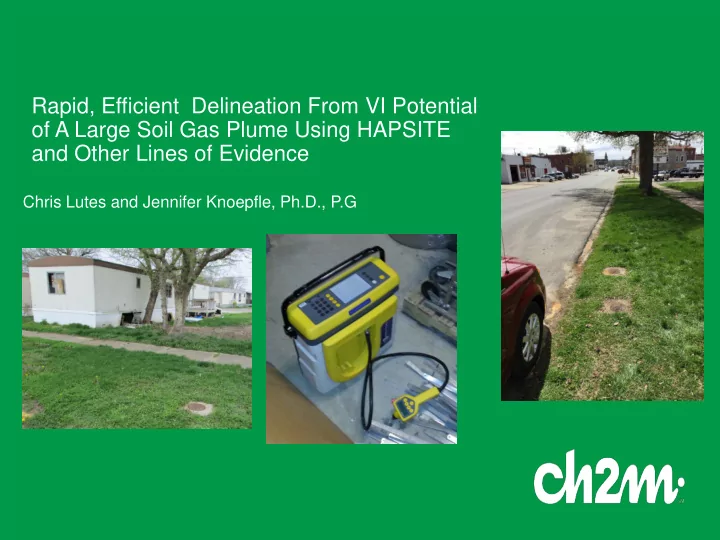
Rapid, Efficient Delineation From VI Potential
- f A Large Soil Gas Plume Using HAPSITE
Rapid, Efficient Delineation From VI Potential of A Large Soil Gas - - PowerPoint PPT Presentation
Rapid, Efficient Delineation From VI Potential of A Large Soil Gas Plume Using HAPSITE and Other Lines of Evidence Chris Lutes and Jennifer Knoepfle, Ph.D., P.G Site Setting Small town in Indiana; EPA led NPL Site Residential and
2 Presentation Title
3 Presentation Title
4 Presentation Title
5 Presentation Title
6 Presentation Title
7 Presentation Title
8 Presentation Title
9 Presentation Title
10 Presentation Title
11 Presentation Title
12 Presentation Title
13 Presentation Title
14 Presentation Title
2 Points 1 10 100 1000 1 10 100 1000 10000 HAPSITE Result (ug/m3) Laboratory Result (ug/m3)
Comparision of HAPSITE to Confirmatory Laboratory Samples for PCE
data Ideal Agreement VISL (PCE) VISL (PCE)
15 Presentation Title