
SLIDE 1
#SIIM18
@LesFolio
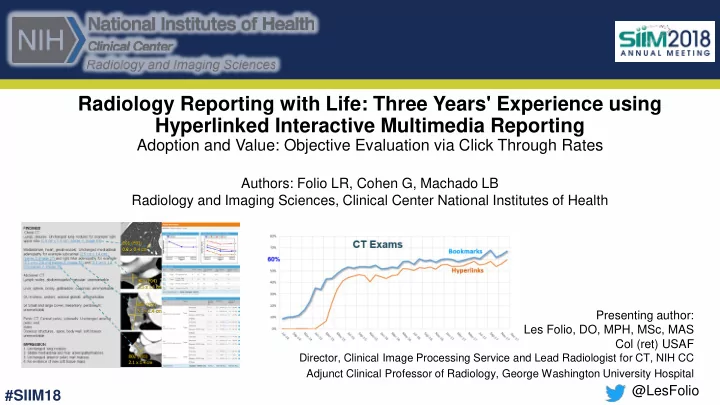
Radiology Reporting with Life: Three Years' Experience using Hyperlinked Interactive Multimedia Reporting
Adoption and Value: Objective Evaluation via Click Through Rates
Presenting author: Les Folio, DO, MPH, MSc, MAS Col (ret) USAF
Director, Clinical Image Processing Service and Lead Radiologist for CT, NIH CC Adjunct Clinical Professor of Radiology, George Washington University Hospital
Authors: Folio LR, Cohen G, Machado LB Radiology and Imaging Sciences, Clinical Center National Institutes of Health