
Seawater Sea‐bottom soil
Prepared based on the reference material delivered at the 3rd Monitoring Coordination Meeting (on Jan. 24, 2012)
Bq/L: becquerels per liter Bq/kg: becquerels per kilogram
(T-1) (M-C3) (M-14) (T-1) (M-C1)
Radiation Monitoring of Ocean
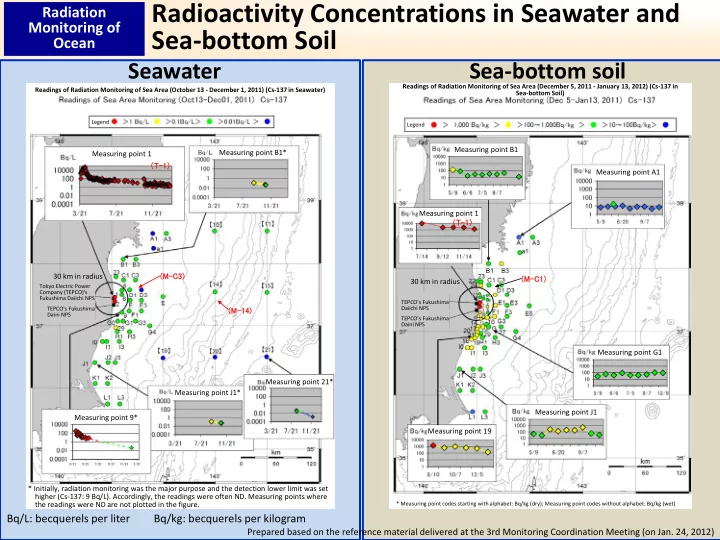
Radioactivity Concentrations in Seawater and Sea‐bottom Soil
Readings of Radiation Monitoring of Sea Area (October 13 ‐ December 1, 2011) (Cs‐137 in Seawater)
Legend
30 km in radius
Tokyo Electric Power Company (TEPCO)'s Fukushima Daiichi NPS TEPCO's Fukushima Daini NPS
Measuring point B1* Measuring point 1 Measuring point 9* Measuring point J1* Measuring point 21* * Initially, radiation monitoring was the major purpose and the detection lower limit was set higher (Cs‐137: 9 Bq/L). Accordingly, the readings were often ND. Measuring points where the readings were ND are not plotted in the figure.
Readings of Radiation Monitoring of Sea Area (December 5, 2011 ‐ January 13, 2012) (Cs‐137 in Sea‐bottom Soil)
Legend
Measuring point B1 30 km in radius
TEPCO's Fukushima Daini NPS TEPCO's Fukushima Daiichi NPS * Measuring point codes starting with alphabet: Bq/kg (dry); Measuring point codes without alphabet: Bq/kg (wet)
Measuring point 1 Measuring point A1 Measuring point G1 Measuring point J1 Measuring point 19