
SLIDE 1
Racial and Ethnic Differences in Foreclosure
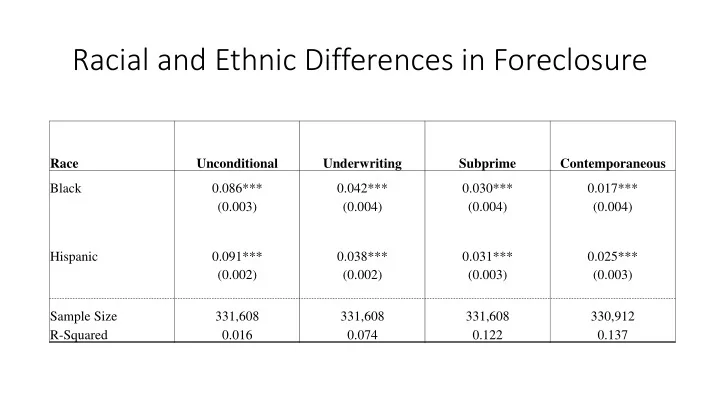
Race Unconditional Underwriting Subprime Contemporaneous Black 0.086*** 0.042*** 0.030*** 0.017*** (0.003) (0.004) (0.004) (0.004) Hispanic 0.091*** 0.038*** 0.031*** 0.025*** (0.002) (0.002) (0.003) (0.003) Sample Size 331,608 331,608 331,608 330,912 R-Squared 0.016 0.074 0.122 0.137