
SLIDE 1
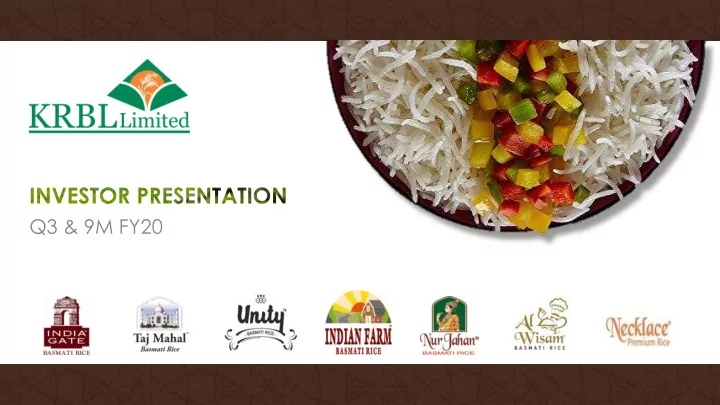
Q3 & 9M FY20 Safe Harbor This presentation contains statements - - PowerPoint PPT Presentation
Q3 & 9M FY20 Safe Harbor This presentation contains statements that contain forward looking statements including, but without limitation, statements relating to the implementation of strategic initiatives, and other statements relating
This presentation contains statements that contain “forward looking statements” including, but without limitation, statements relating to the implementation of strategic initiatives, and other statements relating to KRBL Limited and its affiliated companies (“KRBL”) future business developments and economic performance. While these forward looking statements indicate our assessment and future expectations concerning the development of our business, a number of risks, uncertainties and other unknown factors could cause actual developments and results to differ materially from our expectations. These factors include, but are not limited to, general market, macro‐economic, governmental and regulatory trends, movements in currency exchange and interest rates, competitive pressures, technological developments, changes in the financial conditions of third parties dealing with us, legislative developments, and other key factors that could affect
KRBL undertakes no obligation to periodically revise any forward looking statements to reflect future/ likely events or circumstances.
2
3
KRBL Limited – At a Glance 4 Q3 & 9M FY20 Performance Highlights – Consolidated & Standalone 7 Q3 & 9M FY20 Business Update 13 Introduction to KRBL 16 Shareholding Pattern 21 About KRBL 23
4
Dealer and Distributors Domestic network
years of rich industry experience
Largest exporter of Branded Basmati Rice from India
World’s largest rice milling plant in Punjab, India
Largest well established selling brand in India
rice brands sold under the banner
Global Presence and Exports
Continents
5
Powerful International Distribution— Tie-ups with leading retail chains across the Globe Powerful Domestic Distribution— Tie-ups with leading retail chains across India
KRBL exports to 82 countries across 6 continents
484 Exclusive Dealer and Distributors
Americas Africa Europe Asia Australia Middle East
6
3,160 3,363 3,148 3,247 4,120 FY15 FY16 FY17 FY18 FY19 REVENUE EVOLUTION
Robust growth and profitability improvement creating shareholder value
532 508 654 792 865 FY15 FY16 FY17 FY18 FY19 EBITDA EVOLUTION 322 293 399 434 503 FY15 FY16 FY17 FY18 FY19 PAT 53.3 44.2 60.1 60.0 55.0 46.7 55.8 39.9 40.0 45.0 FY15 FY16 FY17 FY18 FY19 REVENUE % BREAK-UP 1,284 1,498 1,907 2,288 2,727 FY15 FY16 FY17 FY18 FY19 NET WORTH 1.7 1.9 2.1 2.3 2.5 FY15 FY16 FY17 FY18 FY19
DIVIDEND PAYOUT (RS PER SHARE)
(in INR cr)
* Includes Energy Segment
Commenting on the performance for Q3 & 9M FY20, Mr. Anil Kumar Mittal – Chairman and Managing Director, KRBL Limited said,
“KRBL has delivered a strong performance during the quarter with 42% rise in total revenues and 48% improvement in Profits After Tax. The underlying growth in volumes remains healthy where we have continued building out our leadership position in key markets YoY. India Gate has maintained its premier ranking in customer preference and also in improved market share. As the largest brand associated with premium Basmati we are consistently building our presence backed by quality and trust in our brand. We are engaged in this business over multiple generations and naturally hold a long-term view on developing a vibrant market for Basmati worldwide. The efforts of our scientific and research team aligned with farmer connect initiatives have resulted in marked growth in our procurement size year after year. This year is no exception as we take benefit from our experience and expertise in reserving the best quality grain to be aged meticulously. As we grow in size, our turnover and earnings growth will be as much the result of expansion in the India Gate brand as it will be from building presence in newer geographies and initiatives to nurture other kinds of premium Rice.”
8
3,365 3,073 1,520 820 Q3FY19 Q3FY20
Inventory Position Borrowings Position
936 1,329 Q3FY19 Q3FY20 REVENUE FROM OPERATIONS
42.0%
208 243 Q3FY19 Q3FY20 EBITDA 4.55 6.75 Q3FY19 Q3FY20 EPS (IN INR) 107 159 Q3FY19 Q3FY20 PAT 164 211 Q3FY19 Q3FY20 PBT
16.7% 28.5% 48.3% 48.4%
(in INR cr)
9
Highest ever performance during the quarter in terms of Revenue, EBITDA and PAT
(in INR cr)
10
2,924 3,437 9MFY19 9MFY20 REVENUE FROM OPERATIONS
17.5%
631 655 9MFY19 9MFY20 EBITDA 15.48 17.35 9MFY19 9MFY20 EPS (IN INR) 364 409 9MFY19 9MFY20 PAT 536 557 9MFY19 9MFY20 PBT 2,463 3,129 9MFY19 9MFY20 NETWORTH
3.8% 3.9% 12.1% 12.1% 27.0%
Highest ever performance during 9 Months period in terms of revenue, EBITDA, PBT and PAT
11 Rice Sales* Q3FY20 Q3FY19 % change
Qty (in MTS) Rate (in Rs./Mt) Value (in Rs. Cr) Qty (in MTS) Rate (in Rs./Mt) Value (in Rs. Cr) Qty (in MTS)
Price Realization
Value Indian Market Sales 108,007 55,946 604.26 95,541 55,924 534.30 13.05% 0.04% 13.09% Export Market Sales 82,201 79,616 654.45 32,037 104,354 334.32 156.58%
95.76%
Standalone Segment Revenue
* Details on standalone financials
Indian Market Sales reported 13.09% improvement whereas Export Market Sales reported 95.76% growth
62.34% 49.33% 35.78% 49.30% 1.89% 1.36%
Q3FY19 Q3FY20
Agri - India Agri - Export Energy
12 Rice Sales* 9MFY20 9MFY19 % change
Qty (in MTS) Rate (in Rs./Mt) Value (in Rs. Cr) Qty (in MTS) Rate (in Rs./Mt) Value (in Rs. Cr) Qty (in MTS)
Price Realization
Value Indian Market Sales 277,388 57,371 1,591.40 264,779 53,930 1,427.95 4.76% 6.38% 11.45% Export Market Sales 191,755 82,873 1,589.13 143,862 86,021 1,237.51 33.29%
28.41%
Standalone Segment Revenue
* Details on standalone financials
Indian Market Sales reported 11.45% improvement whereas Export Market Sales reported 28.41% growth
54.00% 50.85% 42.35% 46.32% 3.64% 2.83%
9MFY19 9MFY20
Agri - India Agri - Export Energy
13
1,303 1,796 1,327 2,020 1,289 2,462 1,417 3,129 1,994 566 1,150 586 1,087 220 1,176 1,424 173 H1FY16 H2FY16 H1FY17 H2FY17 H1FY18 H2FY18 H1FY19 H2FY19 H1FY20 Inventory Net Debt Most of the debt for the Company is in the form of working capital, which starts rising with the commencement of procurement of paddy in H2 every year and becomes insignificantly low by end of H1 of the next financial year. This is a cyclical phenomenon which results in near zero debt at the end of H1 every year for the company. The company is able to maintain this cycle in spite of increasing procurements at the back of the rising demand environment.
Note: Based on standalone financials
*As on Sep’19, Net Debt excludes Financial Lease Liabilities of Rs. 77.5cr. *As on Sep’18, KRBL is at zero debt with cash surplus of INR 107cr.
(in INR cr)
Focus on delivering consistent free cash flows while enhancing business pie
Borrowings came down from Rs. 1,519 crore in Q3 FY19 to Rs. 820 crore in Q3 FY20 as cash generation was used to build inventories
6 89 219 532 865 FY 95 FY 06 FY 10 FY 15 FY 19
EBITDA (INR CRORE)
markets.
15
Products Business Segments Brands Markets Manufacturing
production to marketing.
Our History since Listing in 1995 …
322 725 1,579 3,197 4,120 FY 95 FY 06 FY 10 FY 15 FY 19
REVENUE FROM OPERATIONS (INR CRORE)
CAGR @22.8% CAGR @22.4%
16
1889 1992 1993 1995 1998 2001 2003 2004 2006 2009 2010 2013 2016 2017 2019
KRBL— Incorporated in 1889 at Lyallpur, Pakistan Shifted focus from
cotton to rice and shifted base from Lyallpur to Lahori Gate, Delhi Established state of the art Basmati processing plant at Ghaziabad Uttar Pradesh Listed at BSE, Delhi Stock Exchange & Ahmedabad Stock Exchange Received ISO-9002 for the Gautam Budh Nagar Plant Received the HACCP & SQF Certification Set up the processing, grading and packaging facility at Dhuri, Punjab Crossed the INR 10bn revenue mark Crossed the INR 20bn revenue mark Strengthened its green energy portfolio with total capacity of 114.35 MW in wind power, 15 MW in solar projects and 17.55 MW in biomass Rice mill / processing unit certified for complying with SOP for export of rice to China and the US Registered as a Public Limited Company Received ISO-9002 for the Alipur, Delhi plant and entered the Indian Market with India Gate and Doon First company to receive FDI in the Indian rice industry GDR Issue of US$12m Stock split. Face value divided from
share Received the Halal certification Set up the fourth facility at Barota Crossed the INR 40bn revenue mark Trade mark registration of its flagship brand ‘INDIA GATE’ registered on 12 August 2019 with a user claim since 01 January 1979 A moment of Pride-KRBL getting featured on Discovery Channel in Flagship series “Inside Out” “God of Grains” Certifications
17 Basmati Rice- Attractive industry dynamics Fully integrated business model KRBL’s unique positioning Strong manufacturing and distribution strengths Robust financial performance/ strong Balance Sheet Opportunities in new growth segments Strong Corporate Governance Conversion from loose to branded basmati Consistently driving exports Developing premium non-basmati rice Increasing consumption pie of basmati
Robust financial performance Attractive dynamics in the Basmati rice market Highly experienced and widely respected management team leading industry wide initiatives Growing presence in the FMCG space and a market dominant brand in domestic and export markets with a premium pricing Strong R&D practice and quality control focus that enables premium pricing Well-developed manufacturing facilities and global distribution network that can support further expansion Fully-integrated supply chain from seed development to branding and marketing 18
A leading FMCG company with dominant market share in branded rice and expanding into other FMCG products
Seed development Contact Farming Procurement Grading Ageing Storage Processing Branding and Marketing
19
Foreign Portfolio Investor
Promoter & Promoter Group
Bank, FI, Insurance & MF
Public/Others
NRI/OCB/Foreign National/QFI
* Promoters have increased their holdings by 0.32% from 58.81% as on December 31st 2018 to 59.13% as on December 31st ,2019 through creeping acquisition of shares.
Anil Kumar Mittal
Chairman and Managing Director
20
Visionary of the company, provides strategic direction to all aspects of the business Over 44 years of experience in the rice industry Founder and former president of All India Rice Exporters Association Arts graduate from Delhi University Recipient of the Silver Jubilee Award from the National Academy of Agricultural Sciences, India Expert on Basmati paddy supply chain management and paddy milling technology Over 36 years of experience in the rice industry Executive member of the Basmati Rice Farmers & Exporters Development Forum Commerce graduate from Delhi University Oversees strategy and financial operations Over 34 years of experience in the rice industry Former Executive Committee Member of the All India Rice Exporters Associations Science graduate from Delhi University Oversees brand management of all KRBL brands Handles corporate affairs and public engagement at the India and international level Over 18 years of experience in the field of international marketing and sales management Co-chairperson of Agri Committee, PHD Chamber of Commerce and Industry Chairperson of Federation of Indian Export Organizations (FIEO), Northern Region, Ministry of Commerce, and Government of India Owner President Management programme from Harvard Business School, BS in Business Management from University of Southern California, LA Special Advisor to the Women Political Leaders Global Forum (formally known as Women in Parliament, a European Parliament Initiative) Over 35 years of experience in finance Previously worked with some of the leading corporates such as Surya Group, Lakhani Group, Sanjay Dalmia Group, Mafatlal Group and Onida Group Chartered Accountant from ICAI and Commerce Graduate from BHU
Arun Kumar Gupta
Joint Managing Director
Anoop Kumar Gupta
Joint Managing Director
Priyanka Mittal
Whole Time Director
Rakesh Mehrotra
Chief Financial Officer
KRBL Limited (NSE: KRBL, BSE: 530813) is the world’s largest rice miller and Basmati rice exporter. It is India's first integrated rice company with an extensive supply chain with a 120-year history and presence since 1889. With manufacturing capacities of 195 MT/per hour, KRBL is a branded Basmati rice company. The Company engages in seed production, touch cultivation, paddy procurement, storage, processing, packaging, basmati rice branding and marketing. Operating divisions of the Company include Agri, which includes agricultural commodities such as rice, furfural, seed, bran and bran oil, among others, and Power, which includes wind turbine, husk-based power plant and solar power plant power generation. The Company offers its rice under a varied range of brands namely India Gate, Nur Jahan and many more. The Company has its presence in the domestic as well as in the international market. It also exports its products to Saudi Arabia, United Arab Emirates, Iraq, Kuwait and Qatar among others.
21
Siddharth Rangnekar / Nishid Solanki CDR, India Tel: +91 22 6645 1209 / +91 22 6645 1221 Email: siddharth@cdr-india.com nishid@cdr-india.com Rakesh Mehrotra KRBL Ltd. Tel: +91‐120‐ 4060 300 Email: investor@krblindia.com For further information, please contact: