
SLIDE 1
Q3 – 2017 Results Webcast &Conference Call
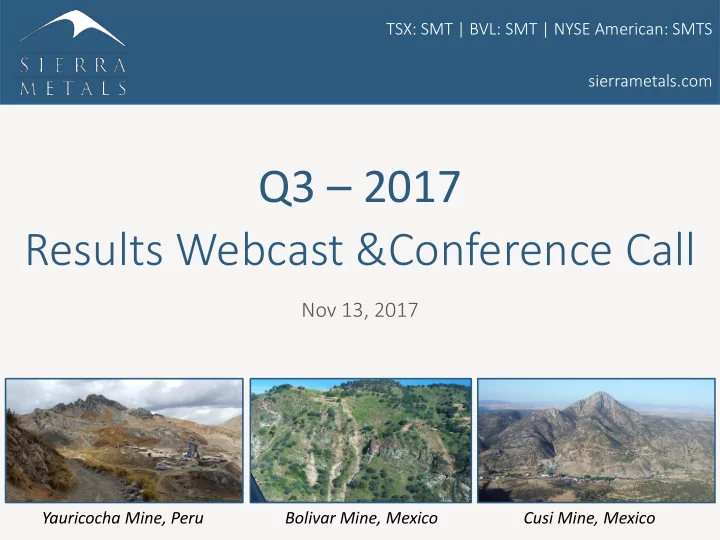
Nov 13, 2017
TSX: SMT | BVL: SMT | NYSE American: SMTS sierrametals.com Yauricocha Mine, Peru Bolivar Mine, Mexico Cusi Mine, Mexico
Q3 2017 Results Webcast &Conference Call Nov 13, 2017 - - PowerPoint PPT Presentation
TSX: SMT | BVL: SMT | NYSE American: SMTS sierrametals.com Q3 2017 Results Webcast &Conference Call Nov 13, 2017 Yauricocha Mine, Peru Bolivar Mine, Mexico Cusi Mine, Mexico Disclaimer Certain statements in this presentation
Nov 13, 2017
TSX: SMT | BVL: SMT | NYSE American: SMTS sierrametals.com Yauricocha Mine, Peru Bolivar Mine, Mexico Cusi Mine, Mexico
2
Certain statements in this presentation constitute forward-looking information within the meaning of Canadian and United States securities legislation. Forward-looking information relates to future events or the anticipated performance of Sierra and reflect management's expectations or beliefs regarding such future events and anticipated performance based on an assumed set of economic conditions and courses of action. In certain cases, statements that contain forward-looking information can be identified by the use of words such as "plans", "expects", "is expected", "budget", "scheduled", "estimates", "forecasts", "intends", "anticipates", "believes" or variations of such words and phrases or statements that certain actions, events or results "may", "could", "would", "might", or "will be taken", "occur" or "be achieved" or the negative of these words or comparable terminology. By its very nature forward-looking information involves known and unknown risks, uncertainties and other factors that may cause actual performance of Sierra to be materially different from any anticipated performance expressed or implied by such forward- looking information. These include estimates of future production levels; expectations regarding mine production costs; expected trends in mineral prices; changes in general economic conditions and financial markets; changes in prices for silver and other metals; technological and operational hazards in Sierra's mining and mine development activities; risks inherent in mineral exploration; uncertainties inherent in the estimation of mineral reserves, mineral resources, and metal recoveries; the timing and availability of financing; governmental and other approvals; political unrest or instability in countries where Sierra is active; labor relations and other risk factors disclosed in Sierra's Annual Information Form, which is available on SEDAR at www.sedar.com and which is incorporated by reference into the prospectus forming part of the Company’s registration statement on Form F-10, filed with the SEC and available at www.sec.gov. Although Sierra has attempted to identify important factors that could cause actual performance to differ materially from that described in forward-looking information, there may be other factors that cause its performance not to be as anticipated. Sierra neither intends nor assumes any obligation to update these statements containing forward-looking information to reflect changes in assumptions or circumstances other than as required by applicable law. There can be no assurance that forward-looking information will prove to be accurate as actual results and future events could differ materially from those currently anticipated. Accordingly, readers should not place undue reliance on forward-looking information. This presentation uses the terms "measured resources", "indicated resources" and "inferred resources" as such terms are recognized under National Instrument 43-101 - Standards of Disclosure for Mineral Projects ("NI 43-101") adopted by the Canadian Securities Administrators. Readers are cautioned not to assume that any part or all of the mineral deposits in these categories will ever be converted into reserves. In addition, "inferred resources" have a great amount of uncertainty as to their existence and economic and legal feasibility. It cannot be assumed that all or any part of an inferred mineral resource will ever be upgraded to a higher category. Under Canadian securities rules, estimates of inferred mineral resources may not form the basis of feasibility or pre-feasibility studies, or economic studies, except for a "preliminary assessment" as defined under NI 43-101. Investors are cautioned not to assume that part or all of an inferred resource exists, or is economically or legally mineable. Gordon Babcock B.Sc., P.Eng., is the qualified person as defined in NI 43-101 and Chief Operating Officer for Sierra Metals supervised the preparation of the operational scientific and technical information for Sierra Metals included in this presentation. Cautionary Note to U.S. Investors: While the terms “measured resources”, “indicated resources”, and “inferred resources” are defined in and required to be disclosed by NI 43-101 these terms are not defined under SEC Industry Guide 7 and are normally not permitted to be used in reports and registration statements filed with the SEC. Investors are cautioned not to assume that all or any part of a mineral deposit in these categories will ever be converted into reserves. Accordingly, information concerning mineral deposits contained in or referred to in this presentation may not be comparable to similar information made public by U.S. companies subject to the reporting and disclosure requirements under the United States federal securities laws and the rules and regulations thereunder. Use of Non-IFRS Financial Measures: This presentation contains “Non-IFRS” financial measures including all in-sustaining costs, EBITDA, Free Cash Flow and Net Debt. Sierra uses these Non-IFRS performance measures and ratios in managing its business. Sierra believes that these measures assist investors in understanding the company’s performance. Non-IFRS financial measures should be viewed in addition to, and not as an alternative for, the reported operating results or cash flow from operations or any other measures prepared in accordance with IFRS. In addition, the presentation of these measures may not be comparable to similarly situated titled measures that other companies use. Please see Reconciliation of IFRS to Non-IFRS Financial Measures in the Appendix to this presentation for a reconciliation to the most comparable IFRS financial measure. Additional Information: Sierra Metals Inc. has filed a base prospectus and a prospectus supplement with the Canadian Securities Commission and a registration statement (including a prospectus and prospectus supplement) with the SEC for an “at the market” offering of its Common Shares (“ATM offering”). Investors considering a purchase of shares in this offering should read the prospectus, prospectus supplement and documents incorporated into that registration statement and other documents that Sierra Metals has filed with the SEC for more information concerning the ATM offering and the issuer. These documents are available without charge from the SEC’s EDGAR database at www.sec.com and on SEDAR at www.sedar.ca.
President and Chief Executive Officer
3
4
Q3 2017 represents a fifth consecutive quarter of solid financial results and was a significant improvement vs Q3 2016
Adjusted EBITDA ($18.8 M)
Revenue ($50.9 M) Cash ($28.6 M)
As at Sept 30, 2017
5
silver equivalent production and 13% increase in throughput at Yauricocha during Q3 2017 vs Q3 2016
29% 17% 6%
Q3 2017 Silver Equivalent Production Q3 2017 Copper Equivalent Production (3.8 M oz) (21.9 M lbs) 504,751 total tonnes processed in Q3 2017
2015, the Company has engaged in an operation turnaround program in Mexico to modernize operations, improve production and address the head grades and recoveries. Improvements already include:
support and improve operations
low 60% range at Cusi and low 70% range at Bolivar
at the Cusi Mine. This development is expected to provide the plant with higher grade
is reached, which is targeted for Q2 2018
early 2018
6
Report updating the Mineral Reserves and Resources at the Yauricocha Mine on November 10, 2017 which was prepared by SRK Consulting (U.S.) Inc.
7
Brownfield Exploration Success Continues at all Mines: Yauricocha
Bolivar
Mine
Company announced the initial results of the drilling program designed to test the anomalies of the Titan 24 Geophysical Survey recently completed on the Bolivar Property Cusi
at Cusi which contains structures that are more than two times the width (3.8 metre average), and nearly twice the silver head grades (372 g/t AgEq) than what has been mined closer to surface.
8
Chief Financial Officer
9
Chief Operating Officer
10
September 30, 2017 September 30, 2016 September 30, 2017 September 30, 2016 Operating Ore Processed / Tonnes Milled 504,751 536,553 1,489,251 1,516,760 Silver Ounces Produced (000's) 507 812 1,821 2,179 Copper Pounds Produced (000's) 6,700 6,156 19,305 17,238 Lead Pounds Produced (000's) 6,358 11,650 23,968 30,561 Zinc Pounds Produced (000's) 19,877 14,435 56,543 39,571 Gold Ounces Produced 1,517 2,305 4,606 6,737 Copper Equivalent Pounds Produced (000's)1 21,851 26,198 69,065 67,309 Silver Equivalent Ounces Produced (000's)1 3,797 2,951 10,862 8,218 Cash Cost per Tonne Processed 48.01 $ 39.87 $ 45.60 $ 40.61 $ Cost of sales per AgEqOz 7.88 $ 7.73 $ 7.72 $ 8.59 $ Cash Cost per AgEqOz2 7.56 $ 7.43 $ 7.39 $ 8.45 $ AISC per AgEqOz2 13.11 $ 13.90 $ 12.36 $ 14.87 $ Cost of sales per CuEqLb2 1.37 $ 0.88 $ 1.20 $ 1.06 $ Cash Cost per CuEqLb2 1.31 $ 0.84 $ 1.15 $ 1.05 $ AISC per CuEqLb2 2.28 $ 1.58 $ 1.93 $ 1.84 $ Cash Cost per AgEqOz (Yauricocha)2 6.55 $ 7.02 $ 6.49 $ 8.21 $ AISC per AgEqOz (Yauricocha)2 10.35 $ 12.64 $ 9.99 $ 13.76 $ Cash Cost per CuEqLb (Bolivar)2 1.69 $ 0.89 $ 1.41 $ 1.13 $ AISC per CuEqLb (Bolivar)2 3.32 $ 1.81 $ 2.56 $ 2.09 $ Cash Cost per AgEqOz (Cusi)2 21.95 $ 9.86 $ 14.72 $ 8.51 $ AISC per AgEqOz (Cusi)2 51.93 $ 19.59 $ 33.59 $ 17.21 $
(2) This is a non-IFRS performance measure, see Non-IFRS Performance Measures section of the MD&A.
Three Months Ended Nine Months Ended (In thousands of dollars, except per share and cash cost amounts, consolidated figures unless noted otherwise)
(1) Silver equivalent ounces and copper equivalent pounds for Q3 2017 were calculated using the following realized metal prices: $16.86/oz Ag, $2.93/lb Cu, $1.08/lb Pb, $1.36/lb Zn, $1,280/oz Au. Silver
equivalent ounces and copper equivalent pounds for Q3 2016 were calculated using the following realized metal prices: $19.17/oz Ag, $2.16/lb Cu, $0.85/lb Pb, $1.02/lb Zn, $1,347/oz Au. Silver equivalent
copper equivalent pounds for 9M 2016 were calculated using the following realized metal prices: $17.61/oz Ag, $2.15/lb Cu, $0.82/lb Pb, $0.90/lb Zn, $1,276/oz Au.
11
Yauricocha
Elissa to test continuity of mineralization , explore new mineralized zones and ore bodies at depth
was completed in Q3 with 20 lines totaling 54 kilometers being surveyed
Mascota to define and determine continuity of ore bodies
Cachi Mine, located 1,000 meters north of the Central Mine
mineralized areas within the Cachi-Cachi Mine, and located within the northern extension of the Esperanza Orebody demonstrating that mineralization from Esperanza continues to the north, and is still open to depth and along strike
additional orebodies along the Yauricocha fault between the Esperanza and Cachi-Cachi ore bodies.
12
the Central Mine area of the Yauricocha Mine
mineralization containing high grade zinc and copper zones over significant widths
more importantly, indicate the continued existence of extensive mineralization at depth
similar widths and grades Bolivar
Bolivar Mine; 7,168 meters were drilled at Bolivar Northwest; 418 meters were drilled in Chimney 2; and 5,504 meters were drilled at Bolivar West.
13
program at the Bolivar West zone, adjacent to the current operations at the Bolivar Mine.
for eight kilometers.
Copper, Zinc and Silver Grades.
significantly above Bolivar’s current resource grade and current head grades. The in-fill drilling covered an area 300 meters long and 180 meters wide.
anomalies of the Titan 24 Geophysical Survey completed on the Bolivar Property highlighting over 40 specific areas of interest
the overall structure below the deposit, in addition to similar structures and mineralization to the
promising anomalies with very positive results
meters; Hole with 583 1.55% CuEq over 33 meters; Hole 585 3.48% CuEq over 13 meters.
14
Cusi
development work on the various veins;
Santa Rosa de Lima zone located adjacent to current operations within the Cusi property.
mineralization, but also gives the Company the opportunity of upgrading this material into a mineral resource.
this area. The Company is currently campaigning development ore and expects to gradually increase the tonnage from this area until its operating the mill at capacity using only ore from Santa Rosa de Lima zone.
expected to be released by the end of 2017.
Southeast as the possibility exists to further define a 12 kilometer zone
Chief Financial Officer
15
Realized Metal Prices 2017 2017 2017 2016 2016 (In US dollars) Q3 Q2 Q1 Q4 Q3 Silver (oz) $16.86 $17.22 $17.71 $16.82 $19.17 Copper (lb) $ 2.93 $ 2.58 $ 2.64 $ 2.38 $ 2.16 Lead (lb) $ 1.08 $ 0.99 $ 1.04 $ 0.95 $ 0.85 Zinc (lb) $ 1.36 $ 1.20 $ 1.27 $ 1.16 $ 1.02 Gold (oz) $1,280 $1,265 $1,231 $1,210 $1,347
16
Revenue Mix by Metal
(12 months ending Sep 30, 2017)
25%
COPPER
18%
LEAD
33%
ZINC
21%
SILVER
3%
GOLD
September 30, 2017 September 30, 2016 September 30, 2017 September 30, 2016 Financial Revenues 50,859 $ 40,757 $ 153,948 $ 101,355 $ Adjusted EBITDA2 18,845 $ 16,264 $ 61,826 $ 25,902 $ Operating cash flows before movements in working capital 21,818 $ 16,870 $ 61,973 $ 28,106 $ Adjusted net income attributable to shareholders2 4,993 $ 5,003 $ 20,241 $ 3,490 $ Net income (loss) attributable to shareholders (6,523) $ 1,367 $ (6,763) $ (7,189) $ Cash and cash equivalents 28,607 $ 27,166 $ 28,607 $ 27,166 $ Restricted cash
3,069 $
3,069 $ Working capital (233) $ 9,064 $ (233) $ 9,064 $
(2) This is a non-IFRS performance measure, see Non-IFRS Performance Measures section of the MD&A.
Three Months Ended Nine Months Ended (In thousands of dollars, except per share and cash cost amounts, consolidated figures unless noted otherwise)
(1) Silver equivalent ounces and copper equivalent pounds for Q3 2017 were calculated using the following realized metal prices: $16.86/oz Ag, $2.93/lb Cu, $1.08/lb Pb, $1.36/lb Zn, $1,280/oz Au. Silver
equivalent ounces and copper equivalent pounds for Q3 2016 were calculated using the following realized metal prices: $19.17/oz Ag, $2.16/lb Cu, $0.85/lb Pb, $1.02/lb Zn, $1,347/oz Au. Silver equivalent
copper equivalent pounds for 9M 2016 were calculated using the following realized metal prices: $17.61/oz Ag, $2.15/lb Cu, $0.82/lb Pb, $0.90/lb Zn, $1,276/oz Au.
17
18
Balance Sheet
(As of September 30, 2017) (000’S)
Cash and Cash Equivalents $29
TOTAL LIQUIDITY $29
BCP Acquisition Credit Facility $42 BCP Credit Facility $8 Lines of Credit and other $19
TOTAL DEBT $69 NET DEBT $40
INVESTOR R RELATIONS NS
Sierra Metals Inc. Mike McAllister Vice President, Corporate Development Tel: 1.416.366.7777 TF: 1.866.493.9646 Email: info@sierrametals.com
CORPO RPORATE O OFFIC FFICE
TD South Tower 79 Wellington Street West, Suite 2100 Toronto, ON M5K 1H1 Tel: 1.416.366.7777 TF: 1.866.493.9646
Follo low us us: www.sierram ametal als. s.com
19
TSX:SMT | BVL:SMT 20
MINES
COUNTRIES
SOLID INVESTMENT OPPORTUNITY
Yauricocha Mine, Peru Bolivar Mine, Mexico Cusi Mine, Mexico