
SLIDE 1
12,178gpt intersection at Paulsens
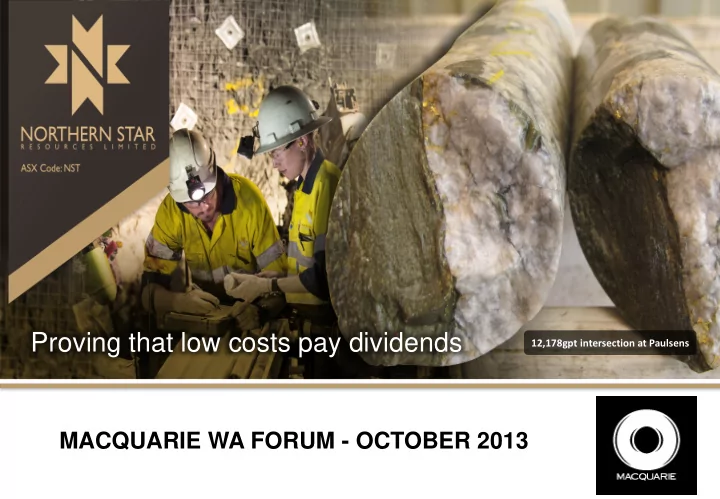
Proving that low costs pay dividends 12,178gpt intersection at - - PowerPoint PPT Presentation
Proving that low costs pay dividends 12,178gpt intersection at Paulsens MACQUARIE WA FORUM - OCTOBER 2013 Disclaimer Competent Persons Statements The information in this announcement that relates to Paulsens and Ashburton mineral resource
12,178gpt intersection at Paulsens
Page 2
Competent Persons Statements
for eventual economic extraction and estimates of exploration potential, is based on and fairly represents information compiled by or under the supervision of Brook Ekers, who is an AIG member who is a full-time employee of Northern Star Resources Limited. Mr Ekers has sufficient experience which is relevant to the style of mineralisation and type
Reporting of Exploration Results, Mineral Resources and Ore Reserves". Mr Ekers consents to the inclusion in the report of the matters based on his information in the form and context in which it appears.
Paulsens Gold Mine, who is a full-time employee of Northern Star Resources Ltd. Mr Stralow has sufficient experience which is relevant to the style of mineralisation and type
Reporting of Exploration Results, Mineral Resources and Ore Reserves". Mr Stralow is a Member of the Australasian Institute of Mining and Metallurgy and consents to the inclusion in the report of the matters based on his information in the form and context in which it appears.
experience relevant to the style of mineralisation and type of deposit under consideration and to the activity which he is undertaking to qualify as a Competent Person as defined in the 2012 Edition of the “Australasian Code for Reporting of Exploration Results, Mineral Resources and Ore Reserves”. Shane McLeay is a Member of the Australasian Institute of Mining and Metallurgy and consents to the inclusion in the report of the matters based on his information in the form and context in which it appears. Forward Looking Statements
fairness, accuracy, completeness or correctness of the information, opinions and conclusions contained in this announcement. To the maximum extent permitted by law, none
fault or negligence on the part of any of them or any other person, for any loss arising from the use of this announcement or its contents or otherwise arising in connection with
announcement nor anything in it shall form the basis of any contract or commitment whatsoever. This announcement may contain forward looking statements that are subject to risk factors associated with gold exploration, mining and production businesses. It is believed that the expectations reflected in these statements are reasonable but they may be affected by a variety of variables and changes in underlying assumptions which could cause actual results or trends to differ materially, including but not limited to price fluctuations, actual demand, currency fluctuations, drilling and production results, reserve estimations, loss of market, industry competition, environmental risks, physical risks, legislative, fiscal and regulatory changes, economic and financial market conditions in various countries and regions, political risks, project delay or advancement, approvals and cost estimates.
Shares Options Total 424M 5M
* As at 15th October 2013
Share price: A$0.815 Market Capitalisation (ASX : NST) ASX 200 Undiluted ~A$346M Cash, Bullion & Investments (30
Sep 2013)
A$50M Top 20: +50% Board - Successful record in discovering and developing mines BILL BEAMENT Managing Director (Mining Engineer) CHRIS ROWE Non Executive Chairman – Independent (Barrister and Solicitor) PETER O’CONNOR Non Executive Director – Independent (Investment Fund Management) JOHN FITZGERALD Non Executive Director – Independent (Resources Finance and Banking) MICHAEL FOTIOS Non Executive Director (Geologist) DISCIPLINES TO OPERATE A MINING BUSINESS ARE COVERED Senior Management STUART TONKIN Chief Operating Officer RAY PARRY Chief Financial Officer LIZA CARPENE Company Secretary BERNIE SOSTAK General Manager BD/Technical Services PHIL TORNATORA General Manager Exploration DARREN STRALOW General Manager (Paulsens) MANAGEMENT CAPACITY TO CATER FOR COMPANY GROWTH
Page 3
Institutions 40% Board and Management 10% High Net Worth Individuals 20% Retail 30%
Page 4
Page 5
Page 6
Page 7
Page 8
Page 9
Page 10
Page 11
Page 12
Page 13
Page 14
12,178gpt intersection at Paulsens
Page 16
1Table 1 – Northern Star Resources As of 30th June 2013 Inclusive of Reserves 2Table 2 – Northern Star Reserves As of 31st December 2012
GOLD MINERAL RESOURCES 1
As at 30 June 2013 Tonnes Grade Ounces Tonnes Grade Ounces Tonnes Grade Ounces Tonnes Grade Ounces Based on attributable ounces (000's) (gpt) (000's) (000's) (gpt) (000's) (000's) (gpt) (000's) (000's) (gpt) (000's)
Surface Paulsens
2.5 47 169 3 14 742 2.5 61
1.0 gpt Au
Belvedere
3.6 19 99 5 16 267 4.2 35
1.0 gpt Au
Merlin
1 24 523 1.4 24
1.0 gpt Au
Mt Clement (20%)
2 13 226 1.8 13
0.5 gpt Au
Underground Upper Paulsens 63 9.7 20 98 13.1 41 119 8 31 280 10.2 92
2.5 gpt Au
Voyager UG 517 12.1 201 173 11.9 66 61 13 26 751 12.2 293
2.5 gpt Au
Stockpiles 118 2.6 10
2.6 10
1.0 gpt Au
Gold in Circuit/Transit
Subtotal Paulsens 698 10.5 235 1,012 5.3 173 1,197 3.2 124 2,907 5.6 532 Surface Mt Olympus
2.3 448 9,138 2.2 632 15,176 2.2 1,080
0.7 gpt Au
Peake
5.2 19 3,544 3.3 380 3,657 3.3 399
0.9 gpt Au
Waugh
3.6 40 240 3.6 28 587 3.6 68
0.9 gpt Au
Zeus
2.1 34 532 2.2 38 1,040 2.2 72
0.9 gpt Au
Electric Dingo
1.6 5 444 1.2 17 542 1.3 22
0.9 gpt Au
Romulus
2.6 27 329 2.6 27
0.9 gpt Au
Subtotal Ashburton
2.4 546 14,227 2.5 1,122 21,331 2.4 1,668 TOTAL RESOURCES 698 10.5 235 8,116 2.8 719 15,424 2.5 1,246 24,238 2.8 2,200
1 Resources are inclusive of Reserves 2 Rounding errors may occurPAULSENS GOLD PROJECT ASHBURTON GOLD PROJECT
MEASURED (M) INDICATED (I) INFERRED (Inf) TOTAL (MI&Inf) Cut Off Grade
GOLD MINERAL RESERVES
1
As at 31 December 2012 Tonnes Grade Ounces Tonnes Grade Ounces Tonnes Grade Ounces Based on attributable ounces
(000's) (gpt) (000's) (000's) (gpt) (000's) (000's) (gpt) (000's)
Surface Paulsens
2.3 31 424 2.3 31 Belvedere
3.2 13 129 3.2 13 Underground Upper Paulsens
6.9 8 36 6.9 8 Voyager UG 328 8.0 84 149 11.1 53 477 8.9 137 Stockpiles 102 3.3 11
3.3 11 Gold in Circuit/Transit
Subtotal Paulsens 430 6.9 99 738 4.4 105 1,168 5.3 204 Surface Mt Olympus 248 3.6 29 113 3.6 13 361 3.6 42 Peake
5.0 8 47 5.0 8 Zeus
2.4 3 38 2.4 3 Subtotal Ashburton 248 3.6 29 198 3.8 24 446 3.7 53 TOTAL RESERVES 678 5.9 128 936 4.3 129 1,614 5.0 257
1 Rounding errors may occurPAULSENS GOLD PROJECT ASHBURTON GOLD PROJECT
PROVED PROBABLE PROVED and PROBABLE