
SLIDE 1
4/5/2018 1
California WaterFix Update
Larry D. Dick, Director Div. 2 Municipal Water District of Orange County
Elected Officials Forum ‐ April 5, 2018 2
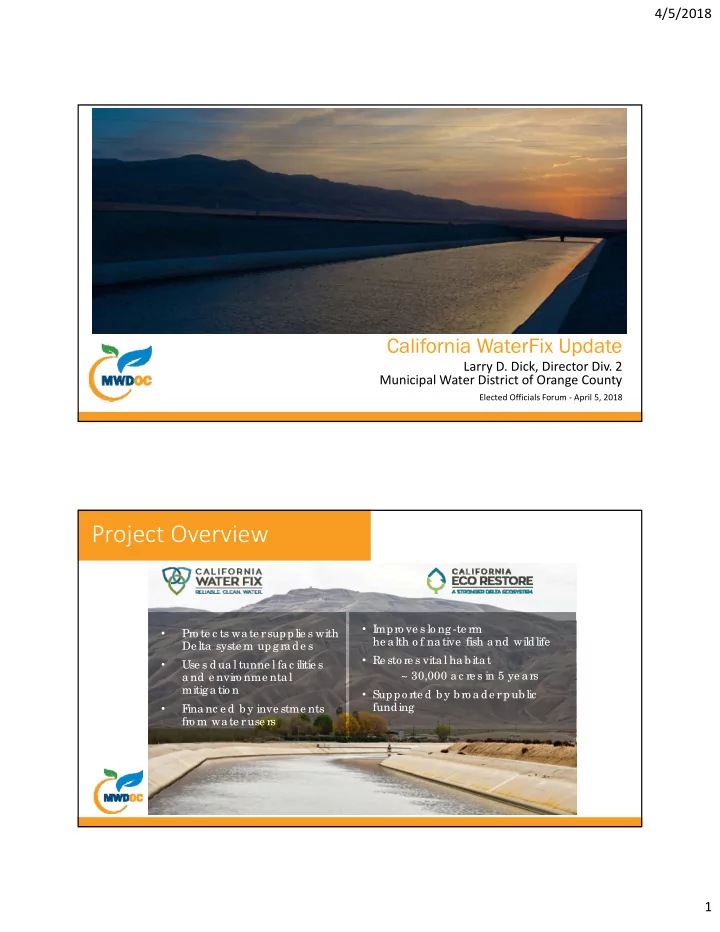
Project Overview
- Pro te c ts wa te r supplie s with
De lta syste m upg ra de s
- Use s dua l tunne l fa c ilitie s
a nd e nviro nme ntal mitig a tio n
- F
ina nc e d b y inve stme nts fro m wa te r use rs
- I
mpro ve s lo ng -te rm he a lth o f na tive fish a nd wildlife
- Re sto re s vita l ha b ita t
~ 30,000 a c re s in 5 ye a rs
- Suppo rte d b y b ro a de r pub lic
funding