Project Overview Effects of Population Size on the Reproductive - - PDF document

project overview effects of population size on the
SMART_READER_LITE
LIVE PREVIEW

Project Overview Effects of Population Size on the Reproductive - - PDF document

Santa Cruz Tarplant Recovery Workshop Coastal Training Program Elkhorn Slough National Estuarine Research Reserve Project Overview Effects of Population Size on the Reproductive Fitness of Project began for an undergraduate thesis


slide-1
SLIDE 1

1

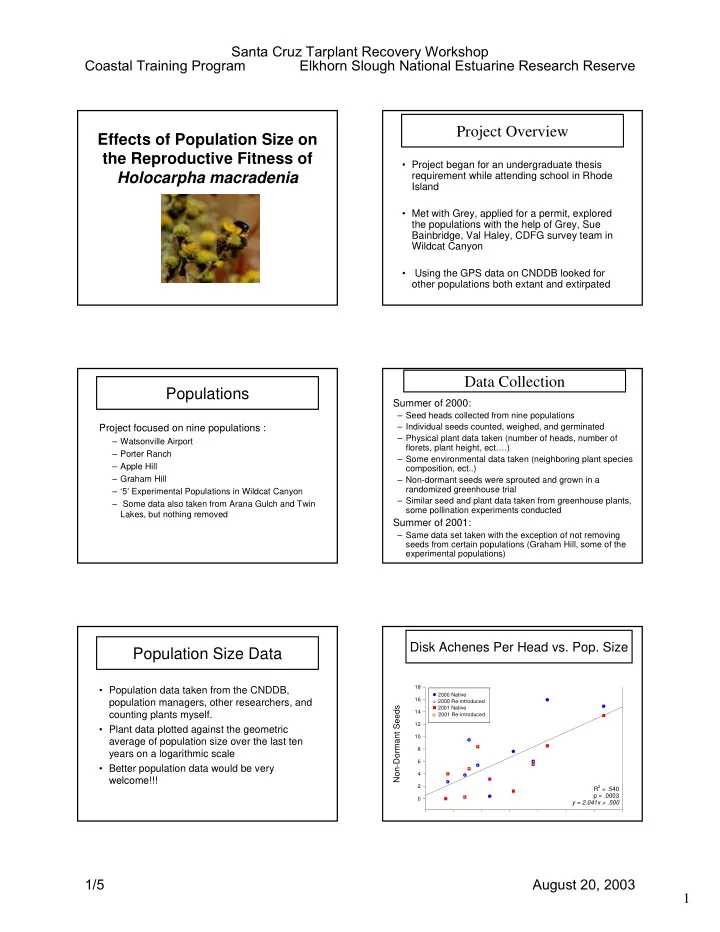
Effects of Population Size on the Reproductive Fitness of Holocarpha macradenia Project Overview

  • Project began for an undergraduate thesis

requirement while attending school in Rhode Island

  • Met with Grey, applied for a permit, explored

the populations with the help of Grey, Sue Bainbridge, Val Haley, CDFG survey team in Wildcat Canyon

  • Using the GPS data on CNDDB looked for
  • ther populations both extant and extirpated

Populations

Project focused on nine populations :

– Watsonville Airport – Porter Ranch – Apple Hill – Graham Hill – ‘5’ Experimental Populations in Wildcat Canyon – Some data also taken from Arana Gulch and Twin Lakes, but nothing removed

Data Collection

Summer of 2000:

– Seed heads collected from nine populations – Individual seeds counted, weighed, and germinated – Physical plant data taken (number of heads, number of florets, plant height, ect….) – Some environmental data taken (neighboring plant species composition, ect..) – Non-dormant seeds were sprouted and grown in a randomized greenhouse trial – Similar seed and plant data taken from greenhouse plants, some pollination experiments conducted

Summer of 2001:

– Same data set taken with the exception of not removing seeds from certain populations (Graham Hill, some of the experimental populations)

Population Size Data

  • Population data taken from the CNDDB,

population managers, other researchers, and counting plants myself.

  • Plant data plotted against the geometric

average of population size over the last ten years on a logarithmic scale

  • Better population data would be very

welcome!!!

Non-Dormant Seeds

2 4 6 8 10 12 14 16 18

R2 = .540 p = .0003 y = 2.041x + .500

Disk Achenes Per Head vs. Pop. Size

2000 Native

2000 Re-introduced

2001 Native

2001 Re-introduced

Coastal Training Program Santa Cruz Tarplant Recovery Workshop Elkhorn Slough National Estuarine Research Reserve 1/5 August 20, 2003

slide-2
SLIDE 2

2

Dormant Seeds

2 4 6 8 10 12 14 16 R2 = .167 p = .0825 y = .872x + 8.252

Ray Achenes Per Head vs. Pop. Size

2000 Native

2000 Re-introduced

2001 Native

2001 Re-introduced

Proportion of Ray Achenes Per Head

  • vs. Population Size

Population Size ( Logarithmic Geometric Average)

1 2 3 4 5 6 7

Porportion Seeds Dormant

0.4 0.5 0.6 0.7 0.8 0.9 1.0 R2 = .368 p = .0059 y = -.0465x + .855 2000 Native

2000 Re-introduced

2001 Native

2001 Re-introduced

1 2 3 4 5 6 7

# non-dormant / head area

0.0 0.5 1.0 1.5 2.0 2.5 3.0 3.5

Number of Disk Achenes per Head Controlled for Head Size

R2 = .337 p = .0091 y = .316x + .711

Population Size (Logarithmic Geometric Average)

1 2 3 4 5 6 7

porportion of dormant seeds / seed head perimeter

8.0e-5 1.0e-4 1.2e-4 1.4e-4 1.6e-4 1.8e-4 2.0e-4 2.2e-4

Proportion of Ray Achenes per Head Controlled for Head Size

R2 = ..432 p = .0077 y = 1.197x + 1.072

Individual Ray Achene Weight

Average Dormant Seed Mass

0.0006 0.0008 0.0010 0.0012 0.0014 0.0016 R2 = .719 p < .0001 y = 1.190e-4x + 6.568e-4

Individual Disk Achene Weight

Average Non-Dormant Seed Mass

0.0000 0.0002 0.0004 0.0006 0.0008 0.0010 0.0012 0.0014 R2 = .219 p = .0673 y = 8.418e-5x + 4.904e-4

Coastal Training Program Santa Cruz Tarplant Recovery Workshop Elkhorn Slough National Estuarine Research Reserve 2/5 August 20, 2003

slide-3
SLIDE 3

3

Total Seed Weight per Head

1 2 3 4 5 6 7

Total Seed Weight per Head

  • 0.005

0.000 0.005 0.010 0.015 0.020 0.025 0.030 0.035 0.040 2000 R2 = .792 p = .0013 y = 5.054e-3x + 5.606e-3 2001 R2 = .530 p = .0262 y = 4.499e-3x + 3.758e-4 t- test p = .0352 1 2 3 4 5 6 7

Percent Germination

0.70 0.75 0.80 0.85 0.90 0.95 1.00

n1 n2 n3 n4 r5 r6 r7 r8 r9

R2 = .173 p = .266

Germination vs. Pop.Size Plant Chacteristics: Longest Branch Length

1 2 3 4 5 6 7

Longest Branch Length (median)

2 4 6 8 10 12 14 16

nA nB n1 n2 n3 n4 r5 r6 r7 r8 r9

R2 = .545 p = .0095

Plant Chacteristics: Total Seed Heads per Plant

1 2 3 4 5 6 7

Total seed heads

2 4 6 8 10 12 14 16

nA nB n1 n2 n3 n4 r5 r6 r7 r8 r9

R2 = .467 p = .0203

Plant Chacteristics: Plant Height

1 2 3 4 5 6 7

Height (median)

6 8 10 12 14 16 18 20 22 24 26 28

nA nB n1 n2 n3 n4 r5 r6 r7 r8 r9

R2 = .122 p = .291

Greenhouse Plants: Density of Disk Achenes

Density of Non-Dormant Seeds

0.0 0.5 1.0 1.5 2.0 2.5 3.0 3.5

n1 n2 n3 n4 r5 r6 r7 r8 r9 n1 n2 n3 n4 r5 r6 r7 r8 r9

Coastal Training Program Santa Cruz Tarplant Recovery Workshop Elkhorn Slough National Estuarine Research Reserve 3/5 August 20, 2003

slide-4
SLIDE 4

4

Greenhouse Plants: Porportion of Ray Achenes

Porportion of Dormant Seeds

0.4 0.5 0.6 0.7 0.8 0.9 1.0

n1 n2 n3 n4 r5 r6 r7 r8 r9 n1 n2 n3 n4 r5 r6 r7 r8 r9

Greenhouse Plants: Total Seed Heads Per Plant

Population Size ( Logarithmic Geometric Average)

1 2 3 4 5 6 7

Total Seed Heads Produced per Plant

5 10 15 20 25 30

n1 n2 n3 n4 r5 r6 r7 r8 r9 n1 n2 n3 n4 r5 r6 r7 r8 r9

Greenhouse Plants: Pollination

Number of Achenes

2 4 6 8 10 12 14 16 18 non-dormant achenes (crossed) non-dormant achenes (selfed) dormant achences (crossed) dormant achenes (selfed) Non-Dormant Seeds (Disk Achenes) Dormant Seeds (Ray Achenes)

Data Summary

  • Smaller Populations Tend to Contain:

– fewer disk achenes (regardless of seed head size) – a higher proportion of dormant seeds (also regardless of seed head size) – lighter dormant seeds – less seed weight per head – plants with fewer seed heads – plants with shorter branches

  • Smaller Populations Do Not Tend to Contain:

– Fewer Dormant Seeds – Lighter disk achenes – Less germinable disk achenes – Smaller plants by all measures

More Data Summary

When grown in a Common Garden Situation:

– Plants in smaller populations DO NOT exhibit any traits that distinguish them from larger populations – Cross-pollinated plants produce more disk achenes than selfed plants but not more ray achenes

Possible Mechanisms for Relationships with Population Size

  • Less pollination leads to less non-dormant

seed production.

  • Stressed plants allocate more energy to

dormant seeds.

  • Stressed plants in unfavorable environments

are producing lighter seeds, fewer seed heads, and fewer branches

Coastal Training Program Santa Cruz Tarplant Recovery Workshop Elkhorn Slough National Estuarine Research Reserve 4/5 August 20, 2003

slide-5
SLIDE 5

5

What does it mean?

  • Apparently no loss of genetic viability in

smaller populations

  • Tarplant Strategy:

– In hard times, go dormant and wait for a stimulus to bring the population back.

  • Bad News: Small tarplant populations

decrease exponentially because they are producing mostly dormant seeds

  • Good News: There should be plenty of

dormant seeds (albeit small ones) should we decide to restore ‘extirpated’ populations

Recommendations for Management

  • Increase Quantity and Quality of Seed Output

in Small Populations

  • Maintain non-dormant seed production

– Increase plant size – Increase pollination

  • Stimulating germination of non-dormant

seeds is important in rehabilitation but many seeds might be very small and more sensitive than larger seeds

Native Populations: Santa Cruz

1980 1985 1990 1995 2000

Population Size

1e-2 1e-1 1e+0 1e+1 1e+2 1e+3 1e+4 1e+5 1e+6 1e+7 1e+8

Precipitation

Re-Introduced Populations: Berkeley

1980 1985 1990 1995 2000

Population Size

1e-2 1e-1 1e+0 1e+1 1e+2 1e+3 1e+4 1e+5

Precipitation

Thank You’s

  • Grey Hayes
  • Sue Bainbridge
  • Val Haley
  • Melanie at CDFG
  • EBMUD Survey Team 2000
  • Advisors back in R.I.

Coastal Training Program Santa Cruz Tarplant Recovery Workshop Elkhorn Slough National Estuarine Research Reserve 5/5 August 20, 2003