
SLIDE 1
Project Justification
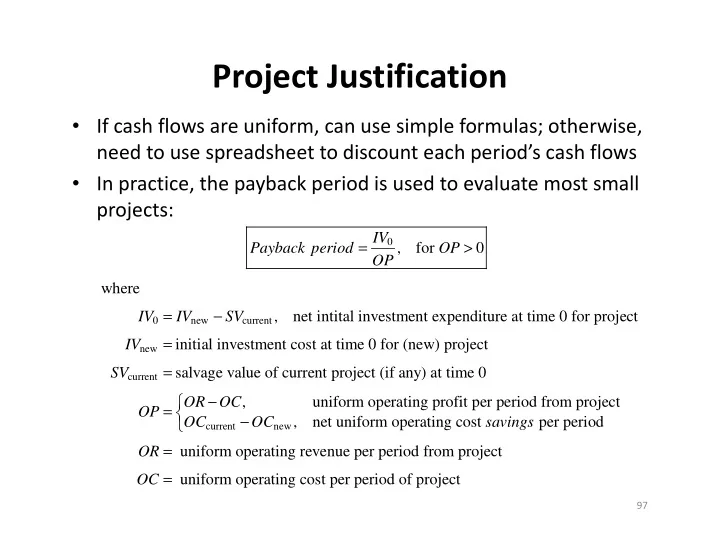
- If cash flows are uniform, can use simple formulas; otherwise,
need to use spreadsheet to discount each period’s cash flows
- In practice, the payback period is used to evaluate most small
projects:
97 new current new current
, for where , net intital investment expenditure at time 0 for project initial investment cost at time 0 for (new) project salvage value of curren IV Payback period OP OP IV IV SV IV SV = > = − = =
current new
t project (if any) at time 0 , uniform operating profit per period from project , net uniform operating cost per period uniform operating revenue per period from proje OR OC OP OC OC savings OR − = − = ct uniform operating cost per period of project OC =