
SLIDE 1
PRODUCING GOLD IN CALIFORNIA PRODUCING GOLD IN CALIFORNIA TSX: GQM - - PowerPoint PPT Presentation
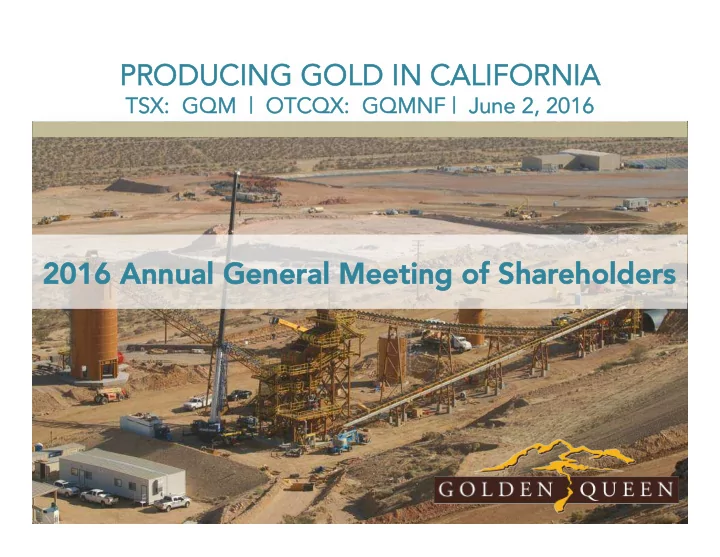
PRODUCING GOLD IN CALIFORNIA PRODUCING GOLD IN CALIFORNIA TSX: GQM | OTCQX: GQMNF | June 2, 2016 TSX: GQM | OTCQX: GQMNF | June 2, 2016 2016 Annual General Meet 2016 Annual General Meeting of Shar ing of Shareholders eholders Pr
¡ ¡ ¡
The information in this presentation includes certain “forward-looking information” and “forward-looking statements” within the meaning
States Private Securities Litigation Reform Act of 1995 and applicable Canadian securities legislation . All statements, other than statements of historical fact, included herein including, without limitation, plans for and intentions with respect to our properties, statements regarding intentions with respect to the Soledad Mountain project’s (the “Project”) current and future operating or financial performance including production, rates of return, recoveries, and operating costs are forward-looking statements. Statements concerning Mineral Reserve Estimates and Mineral Resource Estimates are also forward-looking statements in that they reflect an assessment, based on certain assumptions, of the mineralization that would be encountered and mining results if the Project was mined in the manner described. Forward-looking statements involve various risks and uncertainties. There can be no assurance that such statements will prove to be accurate, and actual results and future events could differ materially from those anticipated in such
intentions include, without limitation, risks and uncertainties regarding: the operation of the Project, including additional capital requirements for the Project or future acquisitions; unexpected liabilities of changes in the cost of operations, including costs of extracting gold and silver; refining costs; operating hazards and risks inherent in mining operations; changes to the political environment, laws or regulation, or more stringent enforcement of current laws or regulations in the United States or California; the ability of Golden Queen Mining Company, LCC to obtain and maintain licenses, access rights or permits, required for current and future planned
non-compliance with environmental and permit requirements. Other risks and uncertainties include risks related to volatility in global equities, commodities, foreign exchange, market price of gold and silver and a lack of market liquidity; changes in planned work resulting from logistical, technical or other factors; that results of operations on the Project will not meet projected expectations due to any combination of technical, operational or market factors; uncertainties involved in the interpretation of technical data and the estimation
Forward looking statements are based on numerous assumptions and are subject to all of the risks and uncertainties inherent in our business, including risks inherent in mining. Investors are cautioned that forward-looking statements are not guarantees of future performance and, accordingly, should not to put undue reliance on forward-looking statements. Any forward-looking statement made by us in this presentation is based only on information currently available. Technical information in this presentation was reviewed and approved Sean Ennis, P . Eng., P .E., an independent consultant of the Company and a Qualified Person as defined by National Instrument 43-101.
3
Tertiary Section ertiary Section High Pr High Pressur essure Grinding Roll (HPGR) e Grinding Roll (HPGR)
4
5
Item (1) December 31, 2015 Cash 37,587,311 Property, plant, equipment and mineral interests 128,562,572 Total assets 169,444,179 Working capital / (deficit) (7,743,109) Current liabilities 47,722,334 Long term liabilities 27,330,560 Net income (loss) and comprehensive income (loss) (2) (5,461,205) Basic income (loss) per share (2) (0.05) Diluted income (loss) per share (2) (0.05)
(1) These consolidated results include the accounts of Golden Queen, Golden Queen Mining Holdings Inc. and GQM LLC. GQM LLC meets the definition of a Variable Interest Entity. Golden Queen has determined that it is the member
as a result, is the primary beneficiary who consolidates GQM LLC. Golden Queen's economic interest in GQM LLC is 50%. (2) Attributable to GQM LTD.
contribution of $12.5mm to the joint venture in June 2015 to maintain its 50% interest in the Project.
existing loan and repaid its convertible debentures in June 2015 ¡
Tertiary Section ertiary Section High Pr High Pressur essure Grinding Roll (HPGR) e Grinding Roll (HPGR)
6
Mining Mining North-W North-West Pit est Pit Heap Leach Pad & Heap Leach Pad & Merrill-Cr Merrill-Crowe Plant
Crushing-Scr Crushing-Screening Plant & eening Plant & Assay Laboratory Assay Laboratory
7
Source: TSX Infosuite
Mining Mining North-W North-West Pit est Pit Heap Leach Pad & Heap Leach Pad & Merrill-Cr Merrill-Crowe Plant
Crushing-Scr Crushing-Screening Plant & eening Plant & Assay Laboratory Assay Laboratory
10
A glittering start to 2016 A glittering start to 2016 The gold price staged a spectacular rally in the first quarter of this year, rising by 17% in US dollar terms. This was its best performance in almost three decades, significantly outperforming other major stock, bond and commodity
emerging markets
central banks
We believe that these factors will continue to support both investment and central bank demand in the coming quarters. Combined with an analysis from past bull-bear cycles, this suggests that we may be entering a new bull market for gold. Source: World Gold Council Source: goldprice.org The long-ter The long-term outlook for gold is str m outlook for gold is strong
Demand for gold continues to outstrip supply. Jewellery and technology applications make up more than 65% of demand, and most gold is bought in the world’s fastest-growing emerging
consumer demand, annually. Mine production, however, accounted for only 74% of gold demand in 2014. In addition, central banks are no longer net sellers of gold, so the rest of the demand is currently fulfilled with recycled gold. With demographic and economic trends predicting increasing wealth and expanded populations in the world’s two largest gold markets, gold demand has the potential to continue rising. Source: World Gold Council Source: Bloomberg
9
Capital Structure – May 10, 2016
Basic Shares Issued 99,928,683 Options 1,070,000 @ US$0.58-US$1.59 strike Warrants 10,000,000 @ US$0.95 strike Fully Diluted Shares 110,998,683 Market Cap (Basic) US$130 MM | C$168 MM Cash * US$16.0 MM Debt ** US$48.4 MM Enterprise Value US$162.3 MM Insiders Ownership ~35.0% Institutional Ownership ~10.0% Public Float ~55.0%
symbol GQM and in the United States on the OTCQX International under the symbol GQMNF
Soledad Mountain property in Kern County, California
with budget (~$100mm)
$1,250/oz and silver price of US$17/oz
~781k oz Ag (Yr2 - Yr11)
(1) Figures shown on 100% basis. ¡ * Cash (March31, 2016) comprised of US $5.4 mm 100% attributable to Golden Queen
Mining Ltd. and 50% of Golden Queen Mining LLC’s cash balance of US$21.3 mm. ** Debt (March 31, 2016) comprised of US$39.7 mm loan and 50% of Komatsu loan (~US $17.4 mm).
11
Thomas M. Clay Thomas M. Clay
Chair Chairman, Interim CEO & man, Interim CEO & Dir Director ector
Robert C. Robert C. Walish alish, Jr , Jr. .
COO COO Pr President & CEO, Golden esident & CEO, Golden Queen Mining LLC Queen Mining LLC
Manager of Chile’s SCM Franke Operation of KGHM International
Carolina, Montana & Nevada and received his Bachelor of Arts degree from the University of Colorado and his Master of Science degree from the University of Wisconsin
Bryan A. Coates Bryan A. Coates
Dir Director ector
Chief Financial Officer of Osisko Mining Corp. with over 30 years of experience in the international and Canadian mining industry
Corporation and the Quebec Mining Association
Guy Le Guy Le Bel Bel
Dir Director ector
Capital with more than 30 years of international mining experience in strategic and financial planning
Ber Bernar nard d Guar Guarnera nera
Dir Director ector
Metallurgical Society of America, Current director, Colorado Mining Association and Broadlands Mineral Advisory Services Ltd. with 40+ years of experience in the global mining industry
Andr Andrée St-Ger ée St-Germain main
Vice Pr ice President Finance & esident Finance & CFO CFO
companies on a variety of financings and M&A advisory assignments
12
In September 2014, Golden Queen Mining Co. Ltd. entered into a joint venture with Gauss LLC, a joint venture owned 70.51% by Gauss Holdings LLC, an entity controlled by Leucadia National Corporation (NYSE:LUK), and 29.49% by Auvergne LLC, an entity controlled by certain members of the Clay family, whereby Gauss LLC invested US$110 million in cash in exchange for a 50% joint venture interest in the Soledad Mountain Project.
Leucadia Leucadia N National C
diversified holding company engaged in a variety of businesses, including investment banking and capital markets, beef processing, asset management, commercial mortgage banking and servicing, manufacturing, auto dealerships, telecommunications, oil & gas, energy projects and real estate. The company has a history of successful investments in the mining sector. Auver Auvergne gne LLC LLC is a wholly-owned entity of the Clay family, who have been long-term, supportive shareholders of Golden Queen. Since the late 1980’s, the Clay family and associated entities have provided significant equity and debt capital to Golden Queen to help fund the exploration and development of the Soledad Mountain Project. Thomas Clay, Manager of Auvergne, has served on the Golden Queen board since 2009 and was appointed Chairman in 2013. ¡ Gauss ¡LLC ¡ JOINT VENTURE Golden Queen Mining Company, LLC ¡ Golden ¡Queen ¡Mining ¡ Holdings ¡Inc. ¡ Golden ¡Queen ¡ ¡ Mining ¡Co. ¡Ltd. ¡
100% ¡Interest ¡ 50% ¡Interest ¡
Auvergne ¡LLC ¡ Leucadia ¡Na7onal ¡Corp. ¡ ¡ (Gauss ¡Holdings ¡LLC) ¡
50% ¡Interest ¡ 70.5% ¡Interest ¡ 29.5% ¡Interest ¡
Soledad ¡ Mountain ¡ Project ¡
¡100% ¡Interest ¡
¡ ¡ Auvergne LLC 13
Gold Silver Classification Tonnes Ton g/t
g/t
Measured 4,298,243 4,738,000 0.960 0.028 13.37 0.39 130,000 1,865,000 Indicated 79,237,167 87,344,000 0.549 0.016 9.26 0.27 1,415,000 23,733,000 Measured & Indicated 83,535,409 92,082,000 0.575 0.017 9.53 0.28 1,545,000 25,598,000 Inferred 21,392,329 23,581,000 0.343 0.010 7.20 0.21 245,000 4,965,000 Gold Silver In-Situ Grade Contained Metal Gold Silver Classification Tonnes Ton g/t
g/t
Proven 3,357,000 3,701,000 0.948 0.028 14.056 0.410 102,300 1,517,100 Probable 42,957,000 47,352,000 0.638 0.019 10.860 0.317 881,300 14,999,100 Total & Average 46,314,000 51,053,000 0.661 0.019 11.092 0.324 983,600 16,516,200 In-Situ Grade Contained Metal Gold Silver
Cautionary Cautionary note note to to U.S. U.S. investors investors concer concerning ning measur measured, ed, indicated indicated or
inferred ed resour esources: ces: We advise U.S. investors that while the terms “measured resources”, “indicated resources” and “inferred resources” are recognized and required by Canadian regulations, the U.S. Securities and Exchange Commission does not recognize these terms and these terms do not comply with SEC Guide 7 requirements. Investors are cautioned not to assume that any part or all of the material in these categories will be converted into reserves. It should not be assumed that any part of an inferred mineral resource will ever be upgraded to a higher category. Cautionary Cautionary note note to to U.S. U.S. investors investors concer concerning ning pr proven
probable
mineral reserve eserve estimates: estimates: This slide uses the terms “proven reserves” and “probable reserves” in accordance with NI 43-101. We advise U.S. investors that the requirements of NI 43-101 for identification of “reserves” are not the same as those of the SEC, and reserves reported by the Company in compliance with NI 43-101 may not qualify as “reserves” under SEC Guide 7 standards. Accordingly, information concerning mineral deposits set forth herein may not be comparable with information presented by companies using only U.S. standards in their public disclosure.
.Eng., APEGBC Registered Member who is employed by Norwest Corporation.
grade was varied to reflect differences in estimated metal recoveries for the different rock types mined.
a Au:Ag recovery ratio of 1.6.
.G. employed as Senior Geologist by Mine Development Associates, Inc.,
a Au:Ag recovery ratio of 1.6.
(100% Basis)
Key Parameters Key Parameters 2015 2015 Feasibility Feasibility Study Study
Estimated Mine Life (Years) 11.3 Average Throughput (k short tons per year) 4,594 Stripping Ratio (waste tons:ore tons) 3.41:1 Au Recovery (%) 82.1% Ag Recovery (%) 50.0% Total Au Production (k oz) 807.4 Total Ag Production (mm oz) 8.3 Average Annual Au Production (k oz) (Year 2 – Year 11) 74 Average Annual Ag Production (k oz) (Year 2 – Year 11) 781
revised reserves.
completed on a quarterly basis for the life of the mine.
been included in the mine plan. Successful infill drilling and expanding the Approved Project Boundary may allow us to significantly increase the mine life.
15
Base Case Economics Base Case Economics
(1) (1)
2015 Feasibility Study 2015 Feasibility Study Pre-Tax NPV 5% $289.5 mm Pre-Tax IRR 32.7% After-Tax NPV 5% $213.9 mm After-Tax IRR 28.3% Operating Costs Operating Costs 2015 Feasibility 2015 Feasibility Study Study Mining Costs per Tonne Mined $1.17/t Mining Costs per Tonne of Ore Processed $5.18/t Processing Costs per Tonne of Ore Processed $4.10/t Site G&A per Tonne of Ore Processed $0.72/t Operating Costs per T Operating Costs per Tonne of Or
e Processed
$9.99/t $9.99/t Total Cash Costs, Net of Silver By-Product (1) (2) $518/ $518/oz
Total Cash Costs, Net of Silver By-Product + Susex (1) (2) (3) $558/ $558/oz
(1) Base case done with a gold price of $1,250/oz and a silver price of $17/oz. $25.4mm spent prior to December 31, 2014 has been excluded from economics. (2) Includes royalties, property taxes, California fees, off-site refining charges, reclamation financial assurance. (3) Sustaining capex includes additional mobile mining equipment acquired between Year 2 and Year 10.
items: cyanide, cement, power, labour, fuel) have been brought current
cash cost
Life of Mine Life of Mine Capital Costs Capital Costs 2015 Feasibility 2015 Feasibility Study (US$) Study (US$) Pre-production Capital Costs $99.3 mm Contingency $15.0 mm Working Capital $10.0 mm Financial Assurance Estimate $0.5 mm Mobile Mining Equipment $19.2 mm Total Pr
e-Production
$144.0 mm $144.0 mm Sustaining Capital Costs $25.5 mm Additional Mobile Mining Equipment (Years 2-10) $10.9 mm Total Life of Mine Capital Costs
$180.5 mm $180.5 mm
capital costs update provided in March 2014.
$12.5mm to the joint venture in June 2015 to maintain its 50% interest in the Project.
project as on budget. ¡
17
$127.2 $170.8 $213.9 $256.5 $298.2 Au ¡$1,050 ¡/ ¡Ag ¡$15 Au ¡$1,150 ¡/ ¡Ag ¡$16 Au ¡$1,250 ¡/ ¡Ag ¡$17 Au ¡$1,350 ¡/ ¡Ag ¡$18 Au ¡$1,450 ¡/ ¡Ag ¡$19
Feasibility Study Feasibility Study Base Case Base Case
After-tax IRR(1) After-tax NPV (5%)(1)
US$ MM 19.7% 24.2% 28.3% 32.3% 36.0% Au ¡$1,050 ¡/ ¡Ag ¡$15 Au ¡$1,150 ¡/ ¡Ag ¡$16 Au ¡$1,250 ¡/ ¡Ag ¡$17 Au ¡$1,350 ¡/ ¡Ag ¡$18 Au ¡$1,450 ¡/ ¡Ag ¡$19
Figures shown on a 100% basis
(1) ¡$25.4mm ¡in ¡capital ¡expenditures ¡spent ¡prior ¡to ¡December ¡31, ¡2014 ¡has ¡been ¡excluded ¡from ¡economics. ¡ ¡
18