problem set i
play

Problem Set I Intro, Measures of Central Tendency & Variability, - PDF document

Problem Set I Intro, Measures of Central Tendency & Variability, Z-scores and the Normal Distribution, Correlation, and Regression 1. Short answer: What is a statistic? Give a definition and an example. Explain how the example illustrates


  1. Problem Set I Intro, Measures of Central Tendency & Variability, Z-scores and the Normal Distribution, Correlation, and Regression 1. Short answer: What is a statistic? Give a definition and an example. Explain how the example illustrates the definition you have provided. 2. A psychologist interested in the dating habits of undergraduates in the Psychology major samples 10 students and determines the number of dates they have had in the last six months. He knows that the mean number of dates is 7.8, and the sum of squares (SS) is 223.2. Assume a normal distribution. A. What percentage of all undergraduate students went on less than 4 dates in the last six months? B. If the psychologist had 10 students total, approximately how many of these students went on between 8 and 13 dates in the last six months? C. What is the number of dates one must have gone on in the last six months in order to 
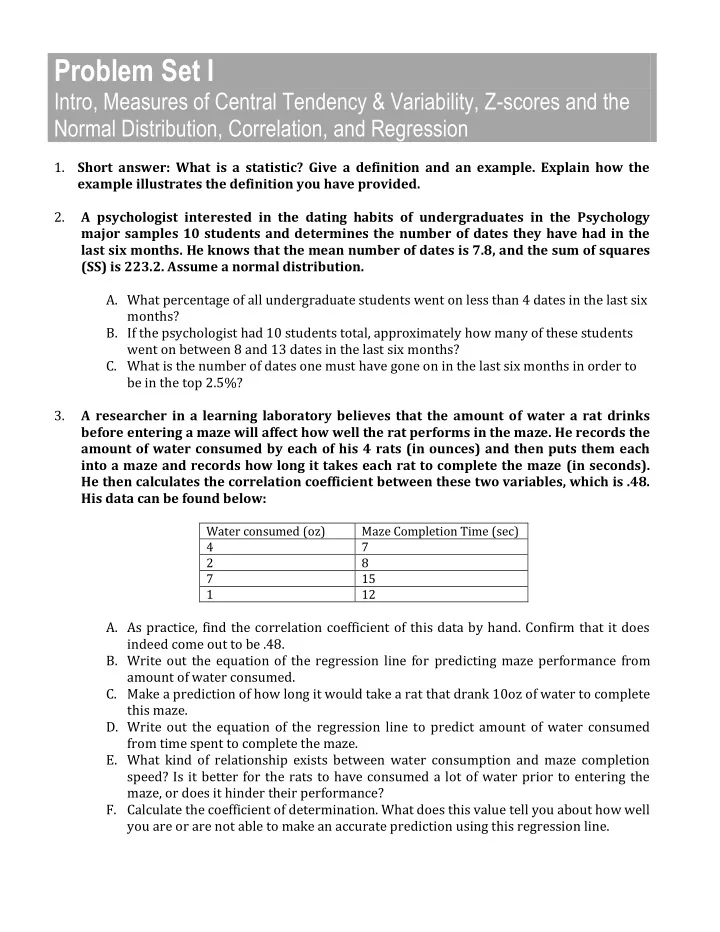
be in the top 2.5%? 3. A researcher in a learning laboratory believes that the amount of water a rat drinks before entering a maze will affect how well the rat performs in the maze. He records the amount of water consumed by each of his 4 rats (in ounces) and then puts them each into a maze and records how long it takes each rat to complete the maze (in seconds). He then calculates the correlation coefficient between these two variables, which is .48. His data can be found below: Water consumed (oz) Maze Completion Time (sec) 4 7 2 8 7 15 1 12 A. As practice, find the correlation coefficient of this data by hand. Confirm that it does indeed come out to be .48. B. Write out the equation of the regression line for predicting maze performance from amount of water consumed. C. Make a prediction of how long it would take a rat that drank 10oz of water to complete this maze. D. Write out the equation of the regression line to predict amount of water consumed from time spent to complete the maze. E. What kind of relationship exists between water consumption and maze completion speed? Is it better for the rats to have consumed a lot of water prior to entering the maze, or does it hinder their performance? F. Calculate the coefficient of determination. What does this value tell you about how well you are or are not able to make an accurate prediction using this regression line.

  2. Problem Set I Intro, Measures of Central Tendency & Variability, Z-scores and the Normal Distribution, Correlation, and Regression 4. Below is a sample of scores on a new version of an IQ test. The range of possible points on this test is 0-100. Name Score Maria 78 John 90 David 50 Julia 65 Marta 100 A. Calculate the mean, standard deviation, and variance of these scores. (do this by hand, show your work) B. What is the z-score obtained by Julia, and what does this z-score tell us about her grade? Suppose you want to know if this IQ test is in any way related to the old IQ test, so you administer a version of the old test to each of these individuals. The following are their scores on the old IQ test: Name Score Maria 110 John 130 David 70 Julia 90 Marta 160 C. Is there a relationship between the scores on the old test and the scores on the new test? In other words, does the new test seem to be measuring IQ in the same way? Describe the relationship. Note: For this question, since it was not specified otherwise, you can use whichever by-hand method you prefer, however it is always better to use BOTH methods just to make sure you are familiar with them and to make sure you get the same answer.

  3. Problem Set I Intro, Measures of Central Tendency & Variability, Z-scores and the Normal Distribution, Correlation, and Regression 5. Over the years, my students have informed me that they feel as though I seem to grade paper assignments according to their length. To assess this relationship, I decide to perform a correlational analysis on the number of pages of 12 papers and the grades I assigned to them. I find that the correlation coefficient (r ) is -.90. The following is also known: Page length Grade x 89 971 805 79717 x 2 Suppose a student had access to this information and wanted to predict their grade for an upcoming paper. Their paper is 3 pages long. A. Write out the equation of the regression line to predict grade from paper length. B. Predict the grade for this student whose paper is 3 pages long. C. If someone received a grade of 100 on their paper, predict the number of pages of their paper (this will involve multiple steps; ie find the equation of the regression line first, then plug in to make a prediction). 6. You are collecting IQ data from a sample of 20 of your classmates. You record the following IQ scores: IQ A. Describe the shape of the distribution of IQ scores. 120 B. Find the Mean, Median, and Mode. Use these values to support your 110 judgment of the distribution’s ¡shape ¡in ¡part ¡A. 120 100 120 130 100 110 130 120 80 140 110 90 70 120 120 110 130 140

Download Presentation
Download Policy: The content available on the website is offered to you 'AS IS' for your personal information and use only. It cannot be commercialized, licensed, or distributed on other websites without prior consent from the author. To download a presentation, simply click this link. If you encounter any difficulties during the download process, it's possible that the publisher has removed the file from their server.

Recommend


More recommend