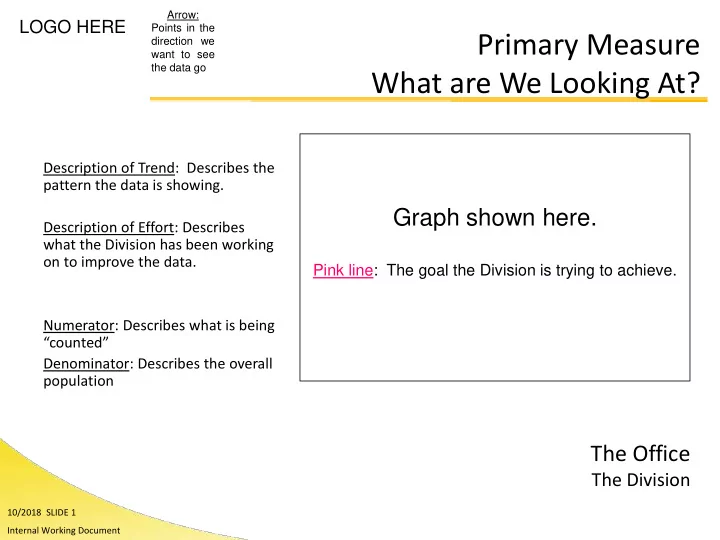

Arrow: LOGO HERE Points in the Primary Measure direction we want to see the data go What are We Looking At? Description of Trend: Describes the pattern the data is showing. Graph shown here. Description of Effort: Describes what the Division has been working on to improve the data. Pink line: The goal the Division is trying to achieve. Numerator: Describes what is being “counted” Denominator: Describes the overall population The Office The Division 10/2018 SLIDE 1 Internal Working Document
Claim Rate FFY17 FFY18 Goal (6.4%) Description of Trend: The number of 25% claims statewide as a percent of total caseload improved in the current month to 7.1%. 20% Numerator: Number of open and active claims Current numerator: 16,237 15% Denominator: Number of open SNAP 12.2% 12.8% Percent 12.4% cases 11.6% 10.6% Current denominator: 229,535 9.5% 9.6% 9.8% 8.9% 10% 7.5% 7.3% 7.1% 5% 0% Month 10/2018 SLIDE 2 Internal Working Document
Meaningful Unit of Analysis: Arrow: LOGO HERE Points in the direction we Reference/Contextual Material want to see the data go Graph shown here. Pink line: The goal the Division is trying to achieve. Reference Data The Office 10/2018 SLIDE 3 The Division Internal Working Document
Claim Rate by 10-Largest Counties ADAMS ARAPAHOE BOULDER DENVER EL PASO JEFFERSON LARIMER MESA PUEBLO WELD BOS 20% 15% Percent 10% 5% 0% Month Reference Data 10/2018 SLIDE 4 Internal Working Document
Arrow: LOGO HERE Points in the Action Item Response direction we want to see the data go Action Required: Details regarding the assignment. Response to assignment shown here. Action Item Response The Office 10/2018 SLIDE 5 The Division Internal Working Document
Division Action Item #2 Impact Estimate Action Required: Bring back the two mock-ups of the proposed impact estimate measures. Re-Entered Applications State Goal (TBD) Numerator: Number of applications processed following a 15% discontinuance in a month. Current Numerator: Denominator: Total number of 10% applications processed in a month. Percent Current Denominator: 5% 0% Month Action Item Response 10/2018 SLIDE 6 Internal Working Document
Recommend
More recommend