
SLIDE 1
Current Strategies for Treating Obesity
1
Robert Baron, MD, MS
CURRENT STRATEGIES FOR TREATING OBESITY
Robert B. Baron MD MS Professor of Medicine Associate Dean for GME and CME Founding Director, UCSF Weight Management Program Declaration of full disclosure: No conflict of interest
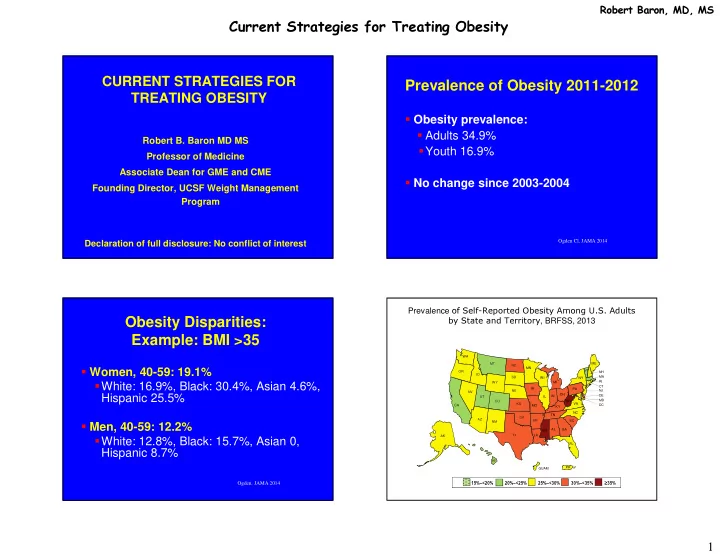
Prevalence of Obesity 2011-2012
Obesity prevalence: Adults 34.9% Youth 16.9% No change since 2003-2004
Ogden Cl, JAMA 2014 Ogden, JAMA 2014
Obesity Disparities: Example: BMI >35
Women, 40-59: 19.1% White: 16.9%, Black: 30.4%, Asian 4.6%, Hispanic 25.5% Men, 40-59: 12.2% White: 12.8%, Black: 15.7%, Asian 0, Hispanic 8.7%
15%–<20% 20%–<25% 25%–<30% 30%–<35% ≥35%
Prevalence of Self-Reported Obesity Among U.S. Adults by State and Territory, BRFSS, 2013
CA MT ID NV UT AZ NM WY WA OR CO NE ND SD TX OK KS IA MN AR MO LA MI IN KY IL OH TN MS AL WI PA WV SC VA NC GA FL NY VT ME HI AK NH MA RI CT NJ DE MD DC PR GUAM