Presented By Benny J. Gallaway , PhD LGL Ecological Research - - PowerPoint PPT Presentation

presented by benny j gallaway phd lgl ecological research
SMART_READER_LITE
LIVE PREVIEW

Presented By Benny J. Gallaway , PhD LGL Ecological Research - - PowerPoint PPT Presentation

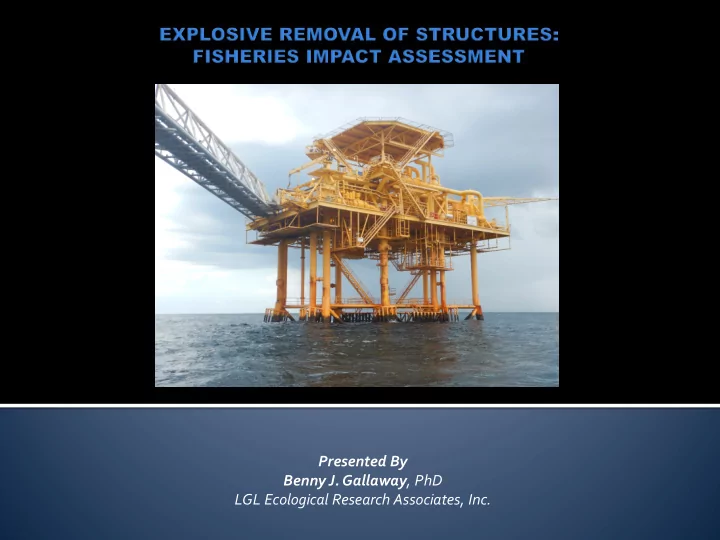
Presented By Benny J. Gallaway , PhD LGL Ecological Research Associates, Inc. Funded by The United States Department of the Interior Bureau of Ocean Energy Management (BOEM) and Bureau of Safety and Environmental Enforcement (BSEE).


slide-1
SLIDE 1

Presented By Benny J. Gallaway, PhD LGL Ecological Research Associates, Inc.

slide-2
SLIDE 2

Funded by The United States Department of the Interior Bureau of Ocean Energy Management (BOEM) and Bureau

  • f Safety and Environmental Enforcement (BSEE).

Environmental Studies Program Contract M16PC00005

2

slide-3
SLIDE 3

 In 2016, the Bureau of Ocean Energy Management

(BOEM), perceived a need for an updated estimate of potential impacts to Gulf of Mexico Fisheries due to OCE explosive decommissioning of offshore oil and gas platforms.

 On June 15, 2016, the Bureau of Safety and Environmental

Enforcement (BSEE) on behalf of BOEM, issued a contract to LGL Ecological Research Associates, Inc. to address this need.

 The study’s focus is the federal waters of the Gulf of

Mexico, western and Central Planning Areas, from the limit

  • f state waters to a water depth of 300 m.

3

slide-4
SLIDE 4

4

2017 Depth Zone (m) Total TX LA MS AL 10 - 17 374 30 297 39 8 18 - 30 247 26 198 20 3 31 - 90 520 50 386 67 17 91 - 300 119 31 66 13 9 1,260 137 947 139 37 2018 Depth Zone (m) Total TX LA MS AL 10 - 17 346 26 275 39 6 18 - 30 229 23 186 17 3 31 - 90 484 47 356 66 15 91 - 300 112 26 65 13 8 1,171 122 882 135 32

slide-5
SLIDE 5

5

slide-6
SLIDE 6

6

slide-7
SLIDE 7

7

slide-8
SLIDE 8

8

slide-9
SLIDE 9

9

N = 368

slide-10
SLIDE 10

I am about to describe some preliminary thoughts that are LGL and LGL’s alone.

BOEM's official position is in line with OCSLA and assumes all OCS facilities are temporary and must be removed at the end of life, unless a waiver is granted.

Therefore, platforms, pipelines, etc. are not considered "habitat" in the same sense as live bottom, and are managed differently (i.e., BOEM & BSEE vs. NMFS).

However, the study does highlight the agencies' recognition of the presence and importance of the fish resources around these facilities and is intended to help BOEM and BSEE evaluate potential impacts of decommissioning activities and inform management decisions.

At this time, BOEM management has not indicated a change in direction or recommendation and, since the study is not complete, I have not presented the analysis or results.

10

slide-11
SLIDE 11

Offshore oil and gas platforms constitute a significant proportion of reef habitat in the Louisiana Red Snapper Management Area and their removal will not only kill the local population but remove habitat for future generations.

We suggest that intensive “reefing” of platforms in this area may be required to avoid massive loss of reef fish production that will likely be associated with platform removal.

11

slide-12
SLIDE 12

Characterize the relative abundance and distribution of commercially and/or recreationally-valuable, federally-managed fish species within the lethal blast radius of explosive severance charges used during decommissioning of fixed OCS platforms;

Develop a technique to estimate or model species-specific mortality of managed fish species due to explosive severance activities, incorporating factors such as severance methods and environmental variables;

Compare study results with mortality estimates currently used in fisheries management plans or recent stock assessments. Quantify resulting differences in abundance or population estimates and determine if, and at what rate of explosive severance operations impact populations;

Develop recommendations that minimize impacts to fish and fisheries to guide BOEM and (BSEE) in authorizing decommissioning activities.

12

slide-13
SLIDE 13

The team assembled to conduct this research includes:

  • Benny J. Gallaway, Ph.D.

Program Manager LGL Ecological Research Associates, Inc.

  • Brad Erisman, Ph.D.

Hydroacoustics P.I. University of Texas Marine Science Institute

  • Stephen T. Szedlymayer Ph.D.

Acoustic Tagging and Telemetry P.I. Auburn University

  • Katherine Kim, Ph.D.

Shock Wave Propagation and Mortality P.I. Greeneride Sciences, Inc.

  • Scott W. Raborn Ph.D.

Data Manager, Analyst LGL Ecological Research Associates, Inc.

  • William Gazey

Stock Assessment P.I. Gazey Research Associates

  • Scott Hickman

Logistics Coordinator Charter Fishermans Association

13 Captain Mike Jennings President Charter Fishermans Association

slide-14
SLIDE 14

 All work conducted in this project is subjected to External

Scientific Peer Review

 The Peer Reviewers are:

  • Dr. Gregg Gitschlag

NOAA Fisheries Galveston Platform Removals

  • Dr. John Walter

NOAA Fisheries, SEFSC Stock Assessment

  • Dr. Edward Chesney

LUMCON Platform Ecology

14

slide-15
SLIDE 15

 The first task (completed) was to conduct a synthesis of

current literature regarding the distribution of federally- managed fish species on or around GOM OCS structures and the expected mortality that these species might experience as a result of underwater detonations.

 This document also provided the basis for finalizing our

preliminary field sampling design.

 The field studies were restricted to the May-October

period of 2017 and 2018.

 A total of 30 platforms were planned to be sampled each

year.

15

slide-16
SLIDE 16

16

slide-17
SLIDE 17

 Hydroacoustic Surveys and Submersible Rotating Video

Cameras (SRVs) were used to estimate the total numbers of fish present, and the species composition of fish at all 60 sites.

17

slide-18
SLIDE 18

 Hook and line sampling was conducted at all 60 sites, also

supplemented by SRV surveys. Fish were identified to species and sex, weighed, measured and the otoliths are extracted.

18

slide-19
SLIDE 19

 Dockside processing was done on the same day that the

samples were collected.

19

slide-20
SLIDE 20

 At a subset of 10 of these platforms, experimental

mark/recapture studies were conducted to obtain independent population estimates for Red Snapper.

20

slide-21
SLIDE 21

Fish were captured by hook and line, anesthetized, weighed measured, tagged with an internally implanted anchor tag, allowed to recover, and then cage released.

21

slide-22
SLIDE 22

 Acoustic telemetry studies were conducted at a subset of 7

(3 in 2017 and 4 in 2018) platforms to determine site fidelity.

 Vertical profiles of temperature, salinity, dissolved oxygen

and turbidity were taken synoptically with each sampling event.

22

slide-23
SLIDE 23

 Platforms harbored significant reef resources including Red

Snapper, Vermilion Snapper, Greater Amberjack, Cobia and

  • ther species.

23

slide-24
SLIDE 24

24

200,000 400,000 600,000 800,000 1,000,000 1,200,000 1,400,000 1,600,000 1,800,000 2,000,000 10 - 17 18 - 30 31 - 90 91 - 300

Numbers of Fish Depth Zone (m)

2017 2018

slide-25
SLIDE 25

25

200,000 400,000 600,000 800,000 1,000,000 1,200,000 1,400,000 1,600,000 1,800,000 2,000,000 10 - 17 18 - 30 31 - 90 91 - 300

Number of Fish Depth Zone (m)

TX LA MS AL

slide-26
SLIDE 26

26

200,000 400,000 600,000 800,000 1,000,000 1,200,000 1,400,000 1,600,000 1,800,000 2,000,000 10 - 17 18 - 30 31 - 90 91 - 300

Number of Fish Depth Zone (m)

TX LA MS AL

slide-27
SLIDE 27

27

4.3% 95.7%

Percent of GOM Red Snapper Stock on Platforms in 2018

3.2% 96.8%

Percent of GOM Red Snapper Stock

  • n Louisiana Platforms in 2018

4.3% stocks occurred on platforms. 3.2% stocks occurred on platforms.

slide-28
SLIDE 28

28

200,000 400,000 600,000 800,000 1,000,000 1,200,000 1,400,000 1,600,000 1,800,000 2,000,000 10 - 17 18 - 30 31 - 90 91 - 300

Numbers of Fish Depth Zone (m)

2017 2018

slide-29
SLIDE 29

29

200,000 400,000 600,000 800,000 1,000,000 1,200,000 1,400,000 1,600,000 1,800,000 2,000,000 10 - 17 18 - 30 31 - 90 91 - 300

Number of Fish Depth Zone (m)

TX LA MS AL

slide-30
SLIDE 30

30

200,000 400,000 600,000 800,000 1,000,000 1,200,000 1,400,000 1,600,000 1,800,000 2,000,000 10 - 17 18 - 30 31 - 90 91 - 300

Number of Fish Depth Zone (m)

TX LA MS AL

slide-31
SLIDE 31

31

4.0% 96.0%

Percent of GOM Vermilion Snapper Stock on Platforms in 2018

2.9% 97.1%

Percent of GOM Vermilion Snapper Stock on Louisiana Platforms in 2018

4.0% stocks occurred on platforms. 2.9% stocks occurred on platforms.

slide-32
SLIDE 32

32

50,000 100,000 150,000 200,000 250,000 300,000 350,000 400,000 10 - 17 18 - 30 31 - 90 91 - 300

Numbers of Fish Depth Zone (m)

2017 2018

slide-33
SLIDE 33

33

50,000 100,000 150,000 200,000 250,000 300,000 350,000 400,000 10 - 17 18 - 30 31 - 90 91 - 300

Number of Fish Depth Zone (m)

TX LA MS AL

slide-34
SLIDE 34

34

50,000 100,000 150,000 200,000 250,000 300,000 350,000 400,000 10 - 17 18 - 30 31 - 90 91 - 300

Number of Fish Depth Zone (m)

TX LA MS AL

slide-35
SLIDE 35

35

29.9% 70.1%

Percent of GOM Greater Amberjack Stock on Louisiana Platforms in 2018

41.8% 58.2%

Percent of GOM Greater Amberjack Stock on Platforms in 2018

41.8% stocks occurred on platforms. 29.9% stocks occurred on platforms.

slide-36
SLIDE 36

36

2,000 4,000 6,000 8,000 10,000 12,000 14,000 16,000 18,000 20,000 10 - 17 18 - 30 31 - 90 91 - 300

Numbers of Fish Depth Zone (m)

2017 2018

(93,167) (86,192) (24,392) (22,703)

slide-37
SLIDE 37

37

2,000 4,000 6,000 8,000 10,000 12,000 14,000 16,000 18,000 20,000 10 - 17 18 - 30 31 - 90 91 - 300

Number of Fish Depth Zone (m)

TX LA MS AL

slide-38
SLIDE 38

38

2,000 4,000 6,000 8,000 10,000 12,000 14,000 16,000 18,000 20,000 10 - 17 18 - 30 31 - 90 91 - 300

Number of Fish Depth Zone (m)

TX LA MS AL

slide-39
SLIDE 39

39

6.3% 94.7%

Percent of GOM Cobia Stock on Platforms in 2018

4.8% 95.2%

Percent of GOM Cobia Stock on Louisiana Platforms in 2018

6.3% stocks occurred on platforms. 4.8% stocks occurred on platforms.

slide-40
SLIDE 40

 As an aside, Ed Chesney and David Reeves have shown

shallow platforms offshore western Louisiana are important habitats for age 0 and age 1 Red Snapper.

40

slide-41
SLIDE 41

41