SLIDE 1 1
Presented at the “2nd Annual Lab Asset & Facility Management in Pharma 2019” Conference, San Diego, CA, October 22nd, 2019
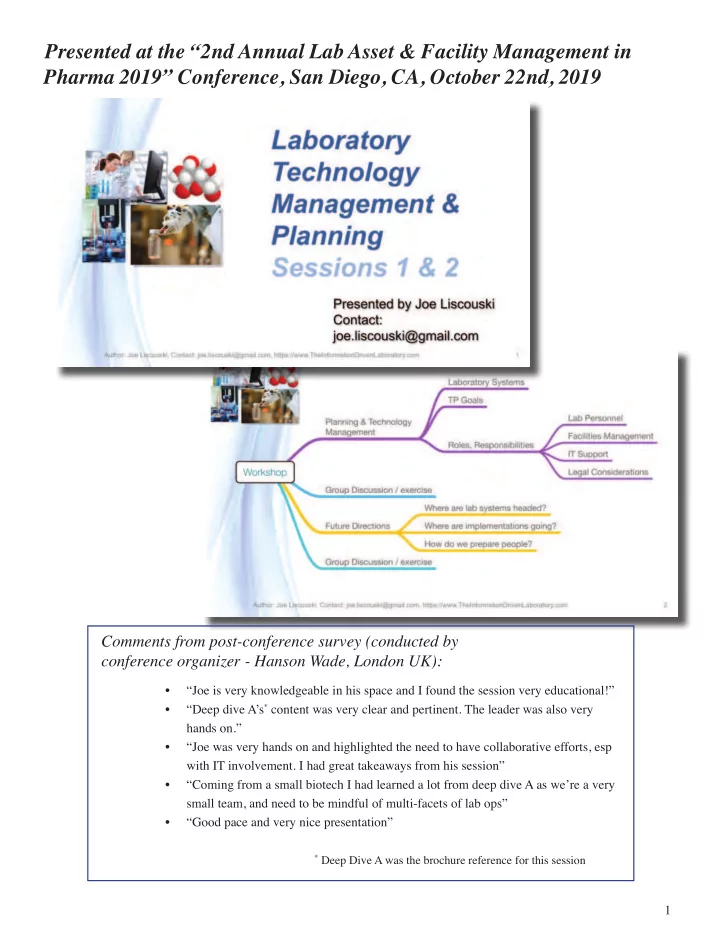
- “Joe is very knowledgeable in his space and I found the session very educational!”
- “Deep dive A’s* content was very clear and pertinent. The leader was also very
hands on.”
- “Joe was very hands on and highlighted the need to have collaborative efforts, esp
with IT involvement. I had great takeaways from his session”
- “Coming from a small biotech I had learned a lot from deep dive A as we’re a very
small team, and need to be mindful of multi-facets of lab ops”
- “Good pace and very nice presentation”
* Deep Dive A was the brochure reference for this session
Comments from post-conference survey (conducted by conference organizer - Hanson Wade, London UK):
SLIDE 2
2
Presented at the “2nd Annual Lab Asset & Facility Management in Pharma 2019” Conference, San Diego, CA, October 22nd, 2019
Is made available under the Creative Commons License:
SLIDE 3 3 This document is based on a presentation delivered at the “2nd Annual Lab Asset & Facility Management in Pharma 2019” conference held in San Diego, CA, on October 22nd, 2019. It is not a verbatim transcript, but an expansion of the material presented. The presentation ran two hours, and even with that there was a limit to the depth I could go into; and even with the added material we are only touching lightly on these topics. Plus there is the ever present “I should have added…” as you move through the material, so that material has been included as well. Why is planning and technology management important? It’s the difference between building a sustainable information infrastructure that will sup- port your work, and a technology house-of-cards that’s going to fail. Among the complaints about scientifjc work - in any discipline - is that it is expensive, ineffjcient, sometimes diffjcult to reproduce and slow to execute. Part of that is due to the nature of research; you are moving into new territory and there is no map. Another aspect to it is that we have a lot of technology to work with but it isn’t used effectively. The reasons we bring advanced technologies into scientifjc work include:
- Enabling us to do things we otherwise couldn’t,
- Improving operational effjciency, and
- Improving the return on corporate investments in scientifjc projects.
Instrumentation, computers, software, networks, from a variety of vendors, are designed to do specifjc jobs but often do not to work well together. And then there are the results of scientifjc work: knowledge, information, and data; often not managed well in incompatible databases, fjles, and spreadsheets. That doesn’t include upgrades to systems and support. An answer to those issues is effective technology management and planning. That work should yield better organized systems, reduced costs, better workfmows and ROI. How do you go about it? That is what we’ll start to address in this material. If you care to discuss any of this material or learn more about the work I’m doing, please contact me through the email address “joe.liscouski@gmail.com”, or visit https://www.TheInformationDrivenLaboratory.com
SLIDE 4
4 When this material was presented live, it was divided into fjve sections. The discussion sections will be omitted as will the survey responses as they were specifjc to the audience. The two remaining section are combined in this docu- ment. The fjrst portion of the material will cover the points noted on the screen in purple.
SLIDE 5 5 The second portion will cover the material underlined in yellow/gold. This is not a futuristic view of labs, but a near- term view of the direction things are likely to go, and importantly, what it is going to take to get there primarily in terms of personnel and education. There are different ways of viewing how we approach laboratory work:
- It begins with questions “how do we make this work?”, “how do we ensure product quality?”, “what is this?”,
“I wonder what happens if I... ?” and the list goes on. Basic and applied research, quality assurance, operating within a building complex or in the fjeld.
- Then we move to place where those questions are addressed, they may be spaces with instruments from chemis-
try, physics disciplines, equipment for life sciences, or rooms for thought experiment, interviews; anywhere that the questions of interest can be addressed.
SLIDE 6 6 Next we deal with the output of laboratory and scientifjc work: the gathering, analysis, reporting and management
- f knowledge / information / and data. This is what it comes down to: the purpose of any laboratory work is to produce
knowledge, information, and data. Those elements drive decisions about the future direction of projects, product develop- ment, establishing policies, etc. Since the primary audience for this material was from the Pharma / Biotech communities the illustrations on the left were appropriate. That doesn’t diminish the applicability of this material to other scientifjc disciplines, just substitute your
- wn equipment, be it telescopes, equipment for optics, mechanical or electrical engineering, your choice. The bottom
line is that you collect measurements, those measurement go into data systems – the lab bench on the right – and are then collected into larger systems that provide for the consolidation of lab results and administrative tasks. From there they are communicated to other groups.
SLIDE 7 7 One important issue in laboratory work is the adoption of standards to facilitate the movement and processing of samples and information fmow, particularly in clinical chemistry with adoption of HL7 and other interchange standards. In the BioPharma world the microplate, shown just below the word “Laboratory” and the sample vials as standard sample containers have greatly eased the handling and processing of samples. The microplate format has led to the development of a variety of devices from different vendors that can work together because they all support the same sample format. This includes plate handing for: sample preparation, move- ment, sealing (to prevent evaporation), spectrometers, imaging, reagent addition, and so on. This has facilitated the devel-
- pment of robotics systems from companies such as Agilent, and complete processing systems from Douglas Scientifjc.
In the latter case instead of physical plates the vendor uses plate-like formats on tapes that are part of a high-throughput processing system.
SLIDE 8
8 The standardization of vial geometries has permitted the development of systems like Baytek International’s Tur- boTube which uses pneumatic tubing to move sample vials between stations, holding areas (Sample Bank) and disposal (Sample Drop). MagneMotion (Devens, MA) has created a sample tube carrier system for routing samples through the lab. These kinds of options mean that considerable planning and attention has to be paid to the physical layout of laboratory spaces if technologies like these are under consideration.
SLIDE 9 9 Once vendors began to address the need for computerized data collection and processing at the instrument (Lab Bench) level, they turned their attention to “higher level data structures” and lab management systems. Beginning with Laboratory Information Management Systems (LIMS) which focuses on sample tracking and results management in test- ing labs, they then turned to scientifjc fjle management (documents, images, fjles, etc.) in the form Scientifjc Document Management Systems (SDMS), and Electronic Laboratory Notebooks (ELNs) in research. Those few sentences gloss
- ver a lot of history and overlapping product introductions and replacements, but that is beyond the scope of what is being
covered here, except for… Except for the fact that the various vendors were watching each other, looking to see what types of functional- ity existed and whether or not they could incorporate similar functions into their products. The end result is some basic product classifjcations, having a primary emphasis (LIMS, ELN, SDMS, instrument data systems) with a lot of overlap in functions, but differing in how those functions are implemented and what you have to do to make use of them. The details are important and beyond the scope of this document, but it does mean that you have to understand those details and account for them in your planning efforts. See items one and two in the references section.
SLIDE 10 10 With that groundwork set, we’ll move onto the primary topic: Technology Management and Planning. Planning exercises can be carried out several ways. One is to provide a list of technologies that you want to imple- ment, so many spectrophotometers, a new instrument, etc. While that might have worked in the days before computer systems were part of the landscape, it won’t now; it will lead to the “house-of-cards” noted in the fjrst slide. Our planning efforts have to start at a higher level and layout a framework for guiding those instrument purchases, adding criteria to support a planned informatics structure, and making sure we know what impact purchases may have, if
- any. In short, we need to set planning goals that can be used to guide our management efforts.
This slide shows the fjrst one and it likely to be something you’ve seen in most management sessions. The red bullets are also pretty obvious and yet when an analysis of project failures is done, one or more of these is usually on the list of neglected items. Things that should have been paid attention to but weren’t. If people are looking a automated systems or software products like a LIMS, they should be well versed in those systems capabilities and their ability to be used in your applications.
SLIDE 11 11 “Development of high quality data and information” – seems like a pretty obvious point, but this is where lab/scien- tifjc experience and the rest of the world part company. Most of the world treats “data” and “information” as interchange- able words. Not here. When an instrument signal is generated it is an analog signal, usually a voltage; there are no digital signals from instruments in the real world. You may point to a digital balance or pH meter and say “what about that?” What you will fjnd in those cases is an analog instrument packaged with a digital control system; the initial measurement is a voltage that is passed to an analog-to-digital (A/D) converter and then on to the control system that manages the dis- play, control, and communications functions. This becomes very important when we deal with more complex instrumen- tation. The chart to the right of the blue line is an output signal from a gas chromatograph. This is what chromatographers analyzed and measured when they carried out their work. The addition of a computer made life easier, but also added complexity to the work. An A/D converter transformed those smooth curves to a sequence of numbers which are pro- cessed to yield parameters that described the peaks, which in turn were used to calculate the amount of substance in
- sample. Everything up to that last calculation is “data” – a set of numerical values that have no meaning, for example the
23rd signal measurement by itself is useless. It is only when we combine it with other data sets that we can calculate a meaningful result, which gives us “information”. Why does this matter? That has to do with our third goal.
SLIDE 12
12 The diagram on the left is a process fmow for our analysis. The “knowledge” is the procedure to carry the analysis, fol- lowed by the arrow on the right which produces the data, which is further analyzed to information. The data and informa- tion may be stored in different places; the information in a LIMS or ELN, and the data with the instrument data system or an SDMS. It is important that the linkage between the information and data be maintained. If the results are questioned, you’ll need access to the underlying data to support it. Beyond that you want to make sure that information and data can be found when it is needed. Putting into a robust structure makes it easy to be combined with other information and put to a more detail analysis. If information and data is hard to fjnd, it won’t be used and a valuable resource will be wasted.
SLIDE 13 13 Another key point in dealing with data and information is that of Data Integrity [where data and information are being used interchangeably]. The defjnition is on the slide and the reference details for the book can be found in the references, item three). The book provides a thorough discussion of the subject. The bottom line is simple: if you don’t have control
- ver your data should you trust it? There is a science fjction book titled “Containment” which carries the line “the only
thing worse than no data is data you can’t trust”. Supportability of products is key. Product vendors have to provide solid support, as do third-parties who may modify
- r develop systems for your use.
SLIDE 14 14 This graphic shows the life cycle of a product including its upgrades, replacement by a new generation, and its retire-
- ment. You need to think about those stages as you purchase something; is it “mature” and on its way to replacement or
retirement? How often is it upgraded and are those upgrades easy to absorb or are they disruptive? One problem that has to be carefully looked at is that of modifjcations made to products to meet user needs. Most product will defjne areas within software as places where changes can be made safely as well places you shouldn’t venture. Developers may ven- ture into those forbidden structures to made adaptations needed to meet user needs. Things may work well for sometime, but when an upgrade or update occurs those changes are compromised and the systems fail. Supportability isn’t some- thing that is assumed, it needs to be called out in development contracts to make sure you are covered.
SLIDE 15
15 Within the BioParma industries meeting regulatory requirement and guidelines isn’t an option even though we occa- sionally hear “we’re in research, we don’t have to validate”. The one thing that statement clearly portrays is that they have no idea what validation is about: the short form from early FDA guidelines reads “documented proof that something works”. If you don’t have that assurance for a process, why are you using it, given that you don’t have solid evidence that it works properly? You may be generating questionable results that will form a basis for decision making. One thing that does have to be understood is that there is a difference between prototyping a process and the produc- tion version. You don’t have to validate the prototype (although it should be well documented) since it will not be used for production work.
SLIDE 16
16 “Integration” is a desirable goal because it presumes that a process is streamlined and effjcient. In the diagram on the left it means that all the process components are inter-connected, that a process output (arrows) is electronically connected to a database (ovals). I’ve been in labs where the printed output from an instrument is carried to a data entry terminal and the technician reads from the paper and types the entries into a LIMS. This is time consuming and error prone; if done properly a second technician would have to verify all the entries. “Harmonization” is an interesting subject for a goal. Done properly it will improve lab operations, improperly and it will be used as an excuse for avoiding work, forcing change, and frustrating the users working in the labs.
SLIDE 17
17 Harmonization can lead to the use of common hardware and software platforms where appropriate. This goal should not be used as a limiting factor on application purchases, if the best tools doesn’t run on a given common platform, that isn’t a reason to discount it. The high level goal is to give people the tools they need to get their work done. If used as a guide in the development of database systems, harmonization can make it easier to access lab data/infor- mation across labs. It may slow down implementations because more peoples opinions have to be taken into account, but the end result will be in the ability to gain more use out of data/information. The benefjts are shown on the slide, including cost reduction and reducing training requirements. If practiced across labs, people will be able to move between them with a reduced need for additional education.
SLIDE 18 18 This slide shows a common LIMS server supporting three different labs. Each lab has it’s own database structure, avoiding confmicts and unnecessary compromises in the conduct of lab work. It does benefjt reduced implementation costs and support costs. Some vendors support this, if they don’t see if they are willing to work a deal since there are multiple labs systems involved. If we couple this with the common data/information structure defjnitions noted earlier, accessing information across labs will be more productive. An alternative is to force everyone into one data structure, usually to reduce costs. Savings on licensing costs may be
- ffset by development delays as multiple labs resolve confmicts in database organization, security, access control, etc. In
short, keep it simple, things will work smoother and in the long run be less costly from an implementation, maintenance, and support perspective. If there is a need/desire to go through the databases for accounting purposes or other organi- zational requirements, the necessary material can be exported into another fjle structure that can be analyzed as needed; this provides a layer of security between the lab and the rest of the organization. It’s basically a matter of planning how database contents are being managed with the lab and what has to be accessed from other parts of the organization.
SLIDE 19 19 Part of the harmonization goal setting is taking a look at how computers are paired with instruments. You may not have multiple instances of higher priced equipment such as mass specs, NMRs, or other instruments and having a com- puter dedicated to each device makes sense. However there is one instrument that you may have several of: chromato-
- graphs. You can purchase a computer for each instrument, but in this case most Chromatography Data Systems can
support multiple instruments. There are advantages to having multiple instruments on one computer:
- Only 1 system to support, maintain, and backup.
- All the data/information is in one system.
- The qualifjcation/validation process is done once instead of having it repeated for each system.
- Overall cost is reduced.
This multi-instrument-one-computer confjguration is the result of a low data collection rate and the modest computing requirements needed to process the instrument data, and, user demands on the vendors. Given the developments in computing power and distributed data acquisition/control this same many-to-one confjgu- ration should be extended to other instrumental techniques, reducing costs and bringing more effjciency to data/informa- tion management.
SLIDE 20 20 With the number of products in the laboratory market you’re going to fjnd a mix of large and small vendors. Some may be small, growing, companies that are managed by a few people and as a result keeping up with the lasted versions of
- perating systems and underlying software may not be critical if it doesn’t affect their products usability or performance.
Their product certifjcation on the latest version of a software platform may lag larger vendors. That means that requiring all systems to be at the same operating system level isn’t realistic. Upgrading the OS may disable the software that lab personnel depend upon.
SLIDE 21 21 The conference noted on the screen will likely have passed by when you read this, and hopefully the topics will con- tinued to be discussed in later meetings. The bullets on the left are from the meetings brochure and have been referred to as “FAIR” taking the fjrst letter of each bulleted word. The point this is addressing is protecting the value of the data/information that you a collecting. No matter how much it cost to produce, if you can’t fjnd the data/information you need, it has no value because it isn’t usable. The same holds true if the data supporting information can’t be found, as we covered a few slides back. Utilization is at the core of much of what we’ve been discussing. Supporting those bullet points should be part
- f every discussion about products and what they produce, database design, and interoperability between labs in
your organization.
SLIDE 22
22 This is a summary of the goals described in this session. Taken as a whole they describe a framework for building a robust software and data/information support structure that will support your organizations scientifjc programs. With that done, we now move onto the responsibilities for lab personnel, IT groups, facilities, and a short note on legal issues.
SLIDE 23
23 We’re going to begin with lab personnel. Our primary focus in this session is technology planning and management so we are going to be looking at things from the standpoint of how technologies are used in improving lab operations, including what is commonly referred to as “lab automation”, or more accurately “automation within the lab”. There are three components of lab work: the science behind the work (planning experiments, development of experi- mental methods, etc.), the execution of the work (manual, semi-automated, automated), and administrative tasks. Our focus is going to be on the second point. Lab personnel are responsible for providing methods that are well grounded in the science, proven (validated), stable, and well documented. They are also responsible for determining the best method of implementation which we will cover later, and…
SLIDE 24
24 … the time frame for implementing the work. The following is taken from reference four: In the slide the blue line represents the growing need for sample/material processing using a given laboratory procedure. Ideally you’d like the automated version to be available when that blue line crosses the “automation needed on-line” level of processing requirements – when you’ve hit the point where the current (manual?) implementation can no longer meet the demands of sample throughput requirements. Those throughput limits are something you are going to have to evaluate and measure on a regular basis and use to make adjustments to the planning process (accelerating or slowing it as appropriate). How fast is the demand growing and at what point will your current methods be over- whelmed? Hiring more people is one option but then the labs operating expenses increase due to the cost of people, equipment and lab space. Once we have an idea of when something has to be working we can begin the process of plan- ning; note: the planning can begin at any point, it would be good to get the preliminaries done as soon as a manual process is fjnalized so that you have an idea of what you’ll be getting into. Those preliminaries include looking at equipment that might be used (keeping track of its development), training requirements, developer resources, and implementation strategies, all of which would be updated as new information becomes available. The “we’ll-get-to-it-when-we-need-it” approach is just going to create a lot of stress and frustration.
SLIDE 25 25 Lab personnel are responsible for producing the User Requirements Specifjcation – here is what we need, and work- ing with the developer’s response, the Functional Specifjcation – you’ve told us what you need, this is how we see it
- working. The next steps include negotiating the fjnal documents, budgets, etc.
The lab users will be involved through out the process but to a lesser degree, until the System Acceptance Testing phase where the developed product(s) are evaluated against the Functional Specifjcation, and then the Performance Quali- fjcation were the fjnal product(s) are looked at in light of user needs. We’ll add more to this list a bit later.
SLIDE 26
26 For decades laboratory fmoor plans were standardized: benches with services, places to store things, mostly assuming that people were doing the work at the bench. Things have changed, instrumentation dominates lab spaces as do comput- ers and the need for networks. Floor plans have to be modular and easily re-organized as needs and equipment changes. Facilities managers also have to allow for robotics (so far we’re not talking about roaming robots, but that may happen), and material transfer between sample preparation rooms and instrument systems; this separation will be more pronounced when hazardous materials are in use. Planning has to be done with a long term perspective to avoid constant re-building.
SLIDE 27 27 One key issue for facilities managers is power: clean, reliable, properly grounded power with backup systems in case
- f power grid failures. The diagram on the screen shows a dirty power line feed, those spikes can show up as software
failures or instrument problems, as can improper grounding (this is particularly true if labs span new and older construc- tion). Computers and instruments are made of analog parts and while they do have power management systems, they do assume a clean electrical environment. All critical systems should be connected to backup power. Generators, particularly those designed for offjce build- ings, often aren’t suitable for computers and digital systems. A better bet is to use battery backup systems (on-line) that clean the incoming power. The typical home UPS’s are pass-through/fail-over designs; the pass through incoming power and then revert to batteries when power drops. On-line systems do continuous fjltering and are usually more expensive. When using these systems you have to plan for the duration of the outage, as they usually are only good for enough time to properly shut systems down. Devices that generate heat (ovens, high-intensity light sources, etc.) can drastically reduce the useful life-time of a battery backup system.
SLIDE 28 28 Both facilities management and IT personnel have to cooperate on security issues, both physical security (entry con- trol, etc.) and electronic systems. The referenced article provides a good overview of the subject, my purpose is to raise the issue and let you research it as needed. Another element that facilities and IT management, along with lab management has to address is the backup of digital
- media. Everything that stores data and information in digital form should be backed up regularly (daily at least) on both
local and remote sites. The bottom line is simple: how much can you afford to lose and still maintain the operational and legal integrity of your lab or organization? Backup policies aren’t simply a matter of doing the backup, but also of testing the process by periodically looking for backed up material to ensure it can be recovered. Earlier we looked at the consolidation of data and information in instrument systems. One consequence of that con- solidation is reducing the effort needed to accomplish a thorough backup program.
SLIDE 29 29 Damage can occur on several levels:
- Individual computers, instruments, robots, or other equipment. These can be resolved by replacement policies.
- Complete automation systems, and,
- All or part of a lab’s operational capabilites.
These problems can be the result of a localized electrical problem, fjre, or storm damage. In each case do you have a backup plan in place to allow you to continue operations? This issue is becoming more acute as climate change cre- ates more severe storms, fmooding, and wide spread power and service outages. How important is it that the lab continue
- perations? In a production environment, it could result in the shutdown of all or part of a plant or manufacturing facility.
Not all labs need extensive backup planning, it’s largely a function of geography and the likelihood of adverse conditions. Our purpose here is not to solve the problems, but to raise them as planning issues.
SLIDE 30
30 IT support can take on a variety of roles beginning with the classical support role common to any business and work- ing their way up through increasing responsibility for project management, coordination of efforts in different labs and working with third parties for development work. While those roles can be found in other working environments, the distinction here is the added knowledge of working with scientists in a very complex environment. You aren’t just dealing with databases, but also instruments, real-time data collection and processing, as well as the mechanical aspects and tim- ing issues in robotics. It’s a multi-disciplinary effort that bridges classical IT support and computer science applied to laboratory work. In that regard, you will have to extend yourself into the lab rather then expecting the scientist to meet you half way. They will view the computer and software as a means of getting the job done and not a primary focus of their efforts.
SLIDE 31 31 In your planning you have to be aware of and protective of intellectual property – to a large extent, that is why labs
- exist. Security is a big factor in IP management, so careful consideration of remote access to system and network security
in general is a large concern. One feature of lab software products is remote access – “you can monitor/access/work with your data and systems from home!” If you don’t have robust security, so can anyone else. One of the options open to you for data/information storage and management are cloud systems; I’ll assume you know about them and their availability for backup and systems such as LIMS and ELNs, at least as starter systems. The legal groundwork for cloud systems is evolving so you need to check anything said here, the references on the following slide will give you a start. The problem is that with cloud systems you may not know where, geographically, those systems and your data/information are sitting, it may be outside your home country. Suppose your home country is the U.S. and your data is spread around servers in different countries; the law governing access to your IP depend upon the laws of those countries. If for example you are using a shared hosting in which your company’s IP is on a server with that
- f other companies, and one of them is under investigation, your IP may be seized simply because it is on the same server.
While networks open a lot of opportunities, those opportunities need to investigated to make sure you are protected.
SLIDE 32
32 Cloud Computing: A Primer on Legal Issues, Including Privacy and Data Security Concerns. https://www.cisco.com/ web/about/doing_business/legal/privacy_compliance/docs/Cloud Primer.pdf TinyURL: http://tinyurl.com/no5dxdo Note: automatically downloads pdf Legal issues to consider with cloud computing http://www.techrepublic.com/blog/tech-decision-maker/legalissues-to-consider-with-cloud-computing/ TinyURL: http://tinyurl.com/q6kp85c Cloud Computing Security Handbook: https://www.limsforum.com/wiki_book/cloud-computing-security-handbook/ Note: if you check the publications>books section of limsforum.com, you fjnd a lot of useful material. Computerized Systems in the Modern Laboratory: A Practical Guide http://www.dhibooks.com/books/17329.html Links noted above:
SLIDE 33
33 That concludes this portion of the material. Now we’ll move on the second part. In this section we’re going to be looking at the future directions of laboratory systems and automation. Our concern is not going to be with futuristic designs, but rather more realistic considerations of what is going to take to move labora- tories into the future to meet the demands that labs are seeing now. In addition we’re going to be focusing on the prepara- tion of people to do this work, because were moving out of peoples comfort zones in both IT and laboratory personnel.
SLIDE 34
34 Last year, in 2018, Smartlab, a division of IQPC, ran a survey of peoples interest in their investments in Smartlab solutions, basically laboratory automation. The results of that survey are shown on the screen. All of these focus on improved return on investment, improving operations and that in turn is driven by automation. This result is no different than that found in any other production environment, a point we will look at it in more detail further down the line in this material. Referenced link: tinyURL: https://tinyurl.com/y9vwnfmg
SLIDE 35
35 When will you look at other surveys for reasons why people get involved with automation, we see the list of items shown on the screen. The effectiveness of automation in meeting these needs has been clearly demonstrated in clinical chemistry work. Clinical chemistry in the 1980s was driven by a problem: the costs for caring out laboratory work we’re going to exceed the income generated by that work. They had to fjnd a solution to the problem. That’s solution was two fold: embrace automation and develop communications standards for the interchange of data/information between laboratory systems including Lab Information Systems (equivalent to LIMS) and hospitable administrative applications. The result has been a signifjcant improvement in productivity (sample throughput) and cost reductions.
SLIDE 36 36 There are four methods of executing laboratory work, three of those involve automation. Those three are shown on the screen.
- Computer Control methods are something we’ve looked at in instrument data systems and robotics.
- Computer Assisted Laboratory work is the use of systems in administrative functions like LIMS and ELNs and
things like that that help organize and process work but are separate from the actual execution.
- The third is Scientifjc Manufacturing. This is a term that was introduced to me by Mr. Alberto Correia of Cam-
bridge Biotech, in Cambridge Massachusetts. It involves the application of manufacturing and production prin- ciples to the execution of laboratory methods and can be very effective.
SLIDE 37
37 The process of automating a method begins with lab personnel. Their responsibilities include the defjnition of a state- ment of need, defjning what has to be done and what potential courses of action have to be taken to make it work. This is also the fjrst step needed in providing a proper validation process. Within that requirement lab personnel are responsible for demonstrating that they have a proven method. That proof includes the items shown on the screen. Labs also need to evaluate the options and alternatives for automation including partial automation during which steps are automated/improved as needed, and full systems automation from sample preparation to the fjnal result.
SLIDE 38 38 Stepwise implementation of automation solutions is something that has been popular in labs for years, primarily because of the perceived lower cost of development. It is commonly referred to as “fjx the bottleneck”. The problem with that approach is that fjxing the bottleneck in one stage just moves it down the line to steps that can’t absorb the increased
- throughput. Starting the automation improvement is best done from the end of the process so that improvements are
- cumulative. It’s a bit like solving a traffjc bottleneck by only widening the road in the middle of its length. The improve-
ment is short-lived. The second set of requirements for lab personnel is justifjcation for the project. The key points are listed on the
- slide. Process stability is a fundamental issue, you don’t want to be chasing a moving target. However processes may see
improvements and modifjcations over time, once the initial implementation is completed. This is analogous to process improvements in other production environments such as evolutionary operations (EVOP) where minor (fully documented) adjustments are made to improve performance with those adjusted tested against the previous set of operating conditions to ensure overall process integrity.
SLIDE 39
39 We’ll continue by looking briefmy at Computer Controlled Processes and Computer-assisted lab work. The entire process that we’re looking at is shown in the blue shapes and covers everything from sample preparation through the inclusion of the results of the work into a LIMS or ELN. Computer control processes involved the fjrst two blue shapes: sample preparation and instrument data systems.
SLIDE 40 40 Computer control methods include functional system such as Instrument Data Systems on the right with auto-sam- plers, the instrument, and the computer servicing them. In addition sample preparation may involve robotics such as the
- ne shown on the screen, the Turbo Tube from Baytek International, or a complete robotic system based on microplate
technologies. Computer-assisted lab work includes Scientifjc Data Management Systems, LIMS, and ELNs.
SLIDE 41
41 Scientifjc Manufacturing is the summation of all those preceding steps drawn into one continuous process. The feasibility of implementing a Scientifjc Manufacturing/Production process depends on the elements shown on the slide. Not all sample preparation lends itself to this, and some equipment is designed strictly for use by people and not automated settings – this was one of the key problems in early laboratory robotics. The educational requirements are signifjcant, not only do people need to understand the science but also have the ability to work with small-scale production environment.
SLIDE 42
42 The potential for Scientifjc Manufacturing systems is real. If we rely for example on standard sample vials and micro- plate technologies, coupled with auto-samplers and Instrument Data Systems we have most of the needed components. The biggest issue may be the initial sample handling and organization. One of the problems with increased sample throughput is the increase in the amount of material that has to be reviewed by lab personnel. We don’t want to create a system where the samples are processed but the results are delayed because people are swamped with reviewing and approving them. In addition, the instrument output has to be reviewed for the appearance of anomalies, in chromatography that means peaks that are unexpected or changes in peak shape that could signal an instrument problem or contamination in the sample. Are the sample processing technologies up to that level of analysis or do new technologies have to be developed? The need for increased sample processing throughput has to be matched with the ability to fully and thoroughly process the results so that confjdence in those results can be main- tained.
SLIDE 43 43 As we move through the stages of automation, beginning with manual execution, assistance through devices such as auto-samplers, sequential step automation and on to a full-automated system, there are changes in:
- Productivity with lower cost as we move from left to right in the diagram,
- Skills needed – this is in addition to skills people already have, people don’t give up skills, they acquire new ones,
- Improved quality and reproducibility of results, and,
- A shift in process fmexibility; highest in the manual case where people can easily adapt to change, and lowest in
the full automation where changes can require redevelopment of the process. The requirement for higher productivity has an overall consequences for the development of new technologies and people with differing skills than we might be looking for in purely manual operating environment.
SLIDE 44
44 Which brings to the next issue under consideration: what backgrounds are needed in both laboratory personnel and IT support to manage the technologies and products being used? This is a list of activities that go on in any lab environment, in any scientifjc fjeld.
SLIDE 45 45 This slide shows the same list along with the formal educational levels, at least at the undergraduate level, for those
- items. At the undergraduate level the focus of education is on the science and not the tools used in the conduct of scien-
tifjc work. To a large extent this isn’t surprising given the amount of material that has to be covered in a four year pro- gram coupled with the cost of the equipment needed to properly educate people in instrumental systems use. The problem is that students aren’t being educated to the level needed to productive in modern laboratories. This quote describes one individuals experience and opinion for the education needed for a modern clinical chemistry lab, were as noted earlier, automated systems are common.
SLIDE 46
46 This quote contrasts the educational goals of standard chemistry with it’s clinical counterpart. What kind of education is needed to work effectively in modern laboratories? Where are people going to get it? People have described their experience with chromatography instruments in undergraduate school as handing a sample to a teaching assistant who ran the sample through the instrument and receiving a printout of the result. Another instructor who had access to a chromatography said that they simply didn’t have the experience to teach the material, their goal was to teach basic science, not instrumental systems. Another put it as “we teach science not computers”.
SLIDE 47 47 In order to be effective, lab personnel need to be able to meet the requirement on the slide. They need to be able to:
- Distinguish potentially useful technologies from those that are not,
- Participate productively in planning sessions,
- Monitor lab processes, recognize when problems are developing and take appropriate corrective action which
might include fjxing the issue or brining in additional resources as needed,
- Use statistical process control methods to ensure that the process is operating within normal boundaries, and,
- Be able to make recommendations for improvements.
SLIDE 48
48 As you can see IT personnel have no formal educational experience with lab work. Their education is going to be informal and on-the-job.
SLIDE 49 49 Laboratory IT support differs considerably from classical IT work. The differences are primarily two fold:
- First, the technologies used in lab work, including those in which instruments are attached to computers and ro-
botics, are different than those commonly encountered in classical IT. The computers are the same, but the added interface and communications requirements imposed by instrument-computer connections change the nature of the work. When trouble-shooting it can be diffjcult to separate computer issues from those resulting the connec- tion to instruments and digital control systems.
- Second, the typical IT specialist, maybe straight out of school, doesn’t have a frame of reference for understand-
ing what they are dealing with in a laboratory setting. The work is foreign, the discussions involve terminology they may not understand, and there may be no common ground for discussing problems. In classical IT, in offjce systems for example, they may be using the same applications software as the people they support; that isn’t the case in lab-IT work. The information in the chart on the slide was prepared by MUSA Technologies, a groups that spent some time doing lab-IT work. There are a wider range of applications, stability is more important than being up-to-date, and a seemingly small issue can have a signifjcant impact on the ability of a team to function.
SLIDE 50
50 We looked at this list earlier, I want to bring it up again to look at roles and the backgrounds needed to meet them. Typical IT backgrounds without considerable lab applications familiarity won’t get you beyond the basic level of support. To be effective IT personnel need to become familiar with the lab environment, the applications and technologies used, and the language of laboratory work. It isn’t necessary for IT support to become experts in instrumental techniques, but rather to understand the basic instrument-control system-computer model, and database applications to the point where they can provide support, advise people on product selections, etc. We need people who can straddle the IT-Lab applica- tion environment. They could be lab people with an interest in computing or IT people with a strong interest in science. See reference fjve for more details.
SLIDE 51 51 There are ways of bridging that gap, but today they depend upon individual initiative more than corporate direction to educate people to the level needed. On-the-job-training is not an effective substitute for real education; on the surface it is cheaper, but you loose out in the long run because people really don’t understand what is going on and that limits their effectiveness and prevents them from being innovative or even catching problems in the early stages before they become
- serious. A big issue is this: due to a lack of education, are people developing bad data/information and not being aware of
it? The problem isn’t limited to the level of systems we are talking about here, but extends to techniques such as pipetting (“The Importance of Liquid Handling Details and Their Impact on your Assays”, John Bradshaw, Artel Inc., delivered at the European Lab Automation Conference, Hamburg Germany, May 30 2012).
SLIDE 52
52 It is also a matter of getting people to understand the breadth of material they have to be familiar with. In 2018 a webinar series was created (also available on-line, see text below for details) to educate management on the planning requirements for implementing lab systems. The live sessions were well attended. The chart shows the viewing rate for the individual topics through October of 2019. Note that the highest viewed items were technology specifjc, people wanted to know about LIMS, ELN, etc. The details about planning, education, support, etc., haven’t received the atten- tion they need. People want to know about product classes, but aren’t willing to learn about what it takes to be successful. Even if you are relying on vendors or consultants, lab management is still accountable for the success of planning, imple- mentation, and effectiveness of lab systems. Link references: webinar seq. title links 1 Introduction (no live presentation) https://youtu.be/6p_aRNTiBQM 2 Laboratory Informatics Technology https://youtu.be/p6FtygPEZS4 3 Lab Informatics & ROI https://youtu.be/e6SfvFEXwSk 4 Technology Planning & Education https://youtu.be/nyIt6j_6qzQ 5 LIMS, ELN, SDMS, IT & Edu https://youtu.be/-8dkKsuEwdU 6 Supporting Lab Systems https://youtu.be/1Oi6Flczt8g 7 Instrument Data Systems https://youtu.be/gvkTjx8veBI 8 Laboratory Processes https://youtu.be/-ppHVRoNkFE
SLIDE 53 53 We need to add a layer of education so that people can acquire the skills needed to be productive using the technolo- gies available, and, have the ability to plan for their inclusion in the normal course of lab work. As a community we need to make sure those working in the lab, and those supporting the systems are properly educated. So what is your company/
Getting back to planning, once you’ve developed a long-term plan, who do you share it with? Discussing them with vendors and consultants you intend to work with will alert them to your thinking and open a discussion of their plans and directions, and how they can help you be successful.
SLIDE 54
54 Moving on to other topics, one of the heavily discussed developments are those around Artifjcial Intelligence (AI) and machine learning. The items on the slide are just a few examples of their application to science, the list grows daily.
SLIDE 55
55 AI has a lot of potential for supporting research, but there are issues that need to be addressed. Most AI applications that are publically disclosed are advisory services to researchers, with humans providing a higher level of judgment on the usefulness of the output. Machine learning can suggest areas worth investigation that people may have missed, but people have to do the over-riding evaluation. Machine learning has also shown promise in image analysis picking up details that people may have missed or fjnding correlations that weren’t apparent; the benefjt of machines is that they don’t suffer from fatigue. The downside to machine learning and AI is that they are subject to input bias. If they are trained on data sets that have a bias, the results of their analysis will be similarly biased. While these systems might be useful as an aid in research, they are inappropriate in regulated environments. The big- gest issue is that we don’t know how they arrive at their conclusions, and as a result they can’t be validated, that is, proven to work; there might be some combination of factors that can lead to a serious problem, the equivalent of the “dead code” issue in programming. This will likely change as the technology advances, but the bottom line question is this: how do you develop trust in their operations? One area where we could use systems like these is in Scientifjc Manufacturing: the analysis of lab results from an evaluation of the instrument data through fjnal results.
SLIDE 56
56 When I originally planned this presentation, this was not one of the topics considered. But Apple’s announcement of Augmented Reality glasses is interesting. When CD-ROMs fjrst became available people talked about the possibility of having libraries on their laptops. AR glasses may give us a way of using those libraries, training videos, etc. while carry- ing out tasks and not having to make space for a computer.
SLIDE 57 57 Any discussion of process work and its relationship to other production environments leads to this point: can we apply process modeling and simulation to lab processes to:
- Optimize performance,
- Look at alternative paths to implementing systems,
- Look for pitfalls before we implement or to test planned approaches,
- Aid in trouble shooting,
- Facilitate training,
- Streamline lab operations, their effectiveness, and ROI.
SLIDE 58 58 This material has covered a lot of ground and there is a lot more that could be looked at. If you’d like to discuss any
- f this further, please contact me via email at joe.liscouski@gmail.com
References:
- 1. “Computerized Systems in the Modern Laboratory: A Practical Guide”, J.Liscouski, published by the PDA and
DHIBooks - https://www.dhibooks.com/books/17329.html
- 2. the LIMSforum at https://www.limsforum.com - this is good source of documents and training courses for labora-
tory informatics. There is no charge for the materials, but you do have to login to use them.
- 3. “Assuring Data Integrity for Life Sciences”, edited by Siegfried Schmitt, published by the PDA and DHIBooks -
https://www.dhibooks.com/books/17335.html
- 4. “Some considerations in the automation of laboratory procedures”, J. Liscouski, https://www.researchgate.net/
publication/329482404_Some_considerations_in_the_automation_of_laboratory_procedures
- 5. “Are You a Laboratory Automation Engineer?”, J. Liscouski, https://www.researchgate.net/publica-
tion/329541487_Are_YOU_a_Laboratory_Automation_Engineer