
SLIDE 1
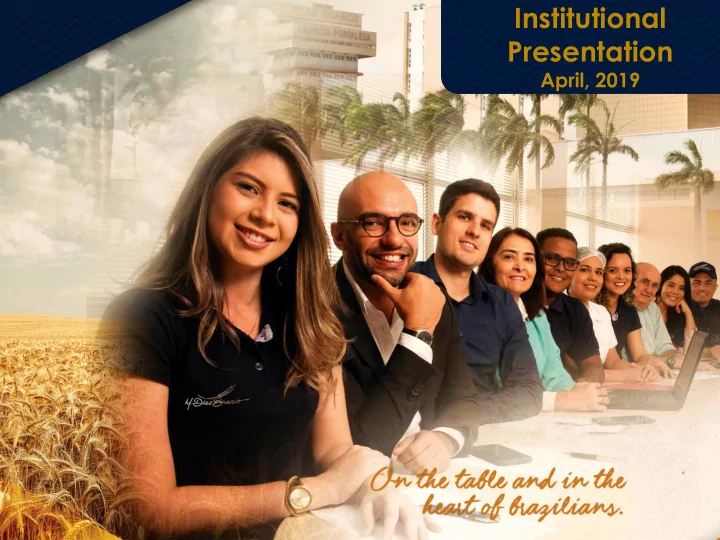
Institutional Presentation
April, 2019
Presentation April, 2019 1. Corporate Profile 2. Results 3. - - PowerPoint PPT Presentation
Institutional Presentation April, 2019 1. Corporate Profile 2. Results 3. Corporate Governance and Capital Market 2 Corporate Profile 3 Over 65 years operating in the food sector in Brazil National Leader in the cookies and pasta markets
Institutional Presentation
April, 2019
2
3
4
Over 65 years operating in the food sector in Brazil National Leader in the cookies and pasta markets Growth strategy and consistent results Strong acquisition track record
5 2018
6 MISSION
We offer high-quality, innovative, healthy, tasty and competitively priced food products for people’s nourishment and enjoyment
VISION
We contribute to society's development through successful and sustainable partnerships, a global presence and diversified business, and are recognized for our respect for people and the environment, ethics, creativity, willingness to serve, simplicity and passion for everything we do
7
55% Production 34% Sales and logistics 11% Administrative
33% women on the Board of Directors
A team with 20 thousand employees focused
8
Recognized Brands Strategically Located Plants Vertically Integrated Integrated Distribution Network National Sustainability Financial solidity and strong cash flow generation Qualified employees
9
Cookies & Crackers¹
% of Sales 2018
Pasta Wheat Flour & Bran
Margarine & Vegetable Shortening
Others ² ¹ Contain Cookies, Crakers and Chocolate covered cookies ² Cakes, snacks, cake mix, and packaged toast
55% 21% 16% 5% 3%
Portfolio with strong national and regional brands
7 brands with anual gross income > R$ 500 MM
19 brands
10
Nota: Gross Revenue excluding discounts
Capacity to make good acquisitions
2003 South and Southeast 2008 Northeast 2011 Northeast 2012 Northeast 2018 Southeast 58% acquired brands
% Revenue by Brand - 2018
20% 42% 15% 11% 6% 4% 2% 11
OTHERS BRANDS
ADRIA was elected in 2016 as one of the "50 most valuable brands in Brazil", according to the ranking published by IstoÉ Dinheiro and prepared by Kantar
12
...and our brands are awarded and recognized
VITARELLA was elected in 2018 as one of the “60 most valuable brands in Brazil", according to the ranking published by IstoÉ Dinheiro and prepared by Kantar ISABELA, a brand of pasta, biscuits and toast, was voted the preferred and most remembered brand in the state of Rio Grande do Sul in 2017.
16.4% 22.9%
Su d est eNote: In 2018 0.6% (0.5% in 2017) of Net Revenue corresponded to exports.
13
North
Northeast
Midwest
Southeast South
69.8% 63.7%
0.0% 10.0% 20.0% 30.0% 40.0% 50.0% 60.0% 70.0% 80.0% 90.0% N6.4% 6.2%
Su l3.9% 3.7%
N3.0% 2.9%
C ent r o Market Share Volume Cookies & Crackers ¹ Period: jan-dec/18 Market Share Volume Pastas ¹Leadership in Cookies & Crackers in 2018 ¹Leadership in Pasta in 2018
14
28% 28% 28% 29% 33% 34%
0% 5% 10 % 15 % 20 % 25 % 30 % 35 % 40 %2013 2014 2015 2016 2017 2018
26% 29% 28% 29% 32% 36%
0% 5% 10 % 15 % 20 % 25 % 30 % 35 % 40 %2013 2014 2015 2016 2017 2018
15
Assertive creation
new products, packaging and categories in line with consumer needs, market trends and scenarios
Hea ealthy with ith fla flavor Co Convenience Ind ndulgence and and exp xperience Nutr utrition Af Affordable
16
Marketing investments to drive sales and to create strong brands
Isabela Vitarella Treloso Vitarella Adria
17
We are also investing on new packages
Previous Packages New Packages
18
Our products are sold through a diversified cliente mix
% Revenue per Client Mix
Small Retail Wholesale Key Accounts/ Regional Chains Cash & Carry
Distribuitors
Other
Industry
Exported to 37 Countries in 2018
2018 2017
5 countries 2017 8 countries 2018 6 countries 2017 6 countries 2018 2 country 2017 2 countries 2018 1 country 2017 2 country 2018 8 countries 2017 11 countries 2018 1 country 2017 2 country 2018 2 country 2016 5 countries 2017
* *
South America Central America África Ásia South America Central America North America Africa Asia Europe Europe Middle East North America Oceania
0 country 2017 1 country 2018
Middle East
19
Fábrica Fortaleza
State of Ceará
Grande Moinho Aratu
State of Bahia
Gorduras e Margarinas Especiais State ofCeará
15 Industrial Plants and 38 Distribution Centers
20
Robust infrastructure and with high level of verticalization
21
63.3% 85.0%
2009 2018
Verticalization Wheat Flour (% total consumption)
52.6% 98.7%
2009 2018
Verticalization Vegetable Fat (% total consumption)
Growth strategy with attractive profitability and return for shareholders
Growth Drivers
▪ Geographies and categories little explored in the core business ▪ Entry into new categories ▪ International markets expansion
Efficiency Drivers
▪ Logistic and production footprint optimization ▪ New business and marketing tools (ex: pricing) ▪ Technology at the service of the business model ▪ Innovation as a source of value generation ▪ Strong team with remuneration aligned to short and long term goals
22
23
2,444 2,911 3,545 4,312 4,580 4,622 5,328 5,415 6,025
2010 2011 2012 2013 2014 2015 2016 2017 2018
24
CAGR 2010-2018: 11.9%
38.5 40.6 53.9 57.9 61.9 65.9 70.0 83.6 80.0
2010 2011 2012 2013 2014 2015 2016 2017 2018
597.1 623.8 664.8 737.5 764.0 769.3 827.7 850.7 781.2
2010 2011 2012 2013 2014 2015 2016 2017 2018
241.1 273.4 309.9 354.7 359.8 340.2 358.1 356.8 388.8
2010 2011 2012 2013 2014 2015 2016 2017 2018
380.0 418.3 489.3 527.4 525.4 503.8 521.8 528.8 556.9
2010 2011 2012 2013 2014 2015 2016 2017 2018
25
CAGR 2010-2018: 4.9% CAGR 2010-2018: 3.4% CAGR 2010-2018: 6.2% CAGR 2010-2018: 9.6%
Cookies and Crackers – Sales (‘000 tonnes) Pasta – Sales (‘000 tonnes) Wheat Flour and Bran – Sales (‘000 tonnes) Margarine and Vegetable Shortening – Sales (‘000 tonnes)
0.81 0.93 0.94 1.06 1.13 1.15 1.21 1.08 1.22
2010 2011 2012 2013 2014 2015 2016 2017 2018
3.54 3.79 3.97 4.38 4.57 4.75 5.26 5.43 5.98
0. 002010 2011 2012 2013 2014 2015 2016 2017 2018
2.15 2.28 2.52 2.77 2.94 3.07 3.36 3.25 3.28
2010 2011 2012 2013 2014 2015 2016 2017 2018
26
CAGR 2010-2018: 6.8% CAGR 2010-2018: 5.3% CAGR 2010-2018: 4.6% CAGR 2010-2018: 6.2%
Cookies and Crackers – Sales (R$/Kg) Pasta – Sales (R$/Kg) Wheat Flour and Bran – Sales (R$/Kg) Margarine and Vegetable Shortening – Sales R$/Kg)
2.39 2.77 2.97 3.38 3.33 3.34 3.72 3.91 3.99
2010 2011 2012 2013 2014 2015 2016 2017 2018
27
CAGR 2010-2018: 10.7%
1,020 1,099 1,423 1,630 1,725 1,666 2,086 2,249 2,294
41.7% 37.7% 40.1% 37.8% 37.7% 35.8% 39.1% 41.5% 38.1%
2010 2011 2012 2013 2014 2015 2016 2017 2018
466.3 481.2 621.6 673.8 770.4 686.6 919.4 966.4 933.0
19.1% 16.5% 17.5% 15.6% 16.8% 14.9% 17.3% 17.8% 15.5%
2010 2011 2012 2013 2014 2015 2016 2017 2018
28
CAGR 2010-2018: 9.1%
351.7 366.5 470.5 524.4 599.3 603.9 784.4 844.3 723.5
14.4% 12.6% 13.3% 12.2% 13.1% 13.1% 14.7% 15.6% 12.0% 2010 2011 2012 2013 2014 2015 2016 2017 2018
29
CAGR 2010-2018: 9.4%
135.3 142.5 117.2 287.9 407.9 456.9 263.9 307.1 301.1
5.5% 4.9% 3.3% 6.7% 8.9% 9.9% 5.0% 5.7% 5.0% 2010 2011 2012 2013 2014 2015 2016 2017 2018
30
CAGR 2010-2018: 10.5%
* Excluding acquisitions
343.3 431.5 334.7 572.6 646.1 490.5 964.2 870.8 779.9
14.0% 14.8% 9.4% 13.3% 14.1% 10.6% 18.1% 16.1% 13.0%
2010 2011 2012 2013 2014 2015 2016 2017 2018 31
CAGR 2010-2018: 10.8%
Operational Cash Generated (R$ million) and Operational Cash/Net Revenue (%)
32
212.8 596.6
0.2 0.6
2010 2011 2012 2013 2014 2015 2016 2017 2018
33
Listed in the “Novo Mercado”
Free Float composed by: 25.8% local investors 74.2% foreign investors
03 independent members on the Board of Directors.
Audit Committee composed by 3 independent members
Ordinary stocks ( 339 millions)
Shareholder Position as of 12/28/2018.
National Long-Term Rating 'AAA (bra)'
63.32% 11.68% 25.00%
Free Float Controlling shareholder DIBRA Board of Directors and Officers
50% 150% 250% 350% 450% 550% 650% 750% 850%
5,000 7,500 10,000 12,500 15,000 17,500 20,000 22,500 25,000 27,500 30,000 32,500 35,000 37,500 40,000
34
Average Daly Volume : MDIA3 (R$ 000)
Profitability%
MDIA3 x IBOV 10/17/2006 a 12/28/2018
35
Nutrition and Health Packaging Waste Water - Effluents | Energy - Emissions Social Investments and Communities Transparency and Dialogue Inputs
Topics of Work Groups
“Expand business and generate value with responsibility to current and future generations”
Constant Evolution on social, environmental and Corporate Governance topics
Areas of expertise
36
Geraldo Luciano Mattos Júnior Vice-President of Investments and Controllership Fabio Cefaly New Business and Investor Relations Director Fernanda Carvalho New Business and Investor Relations Manager Renata Lessa New Business and Investor Relations Analyst
Phone: +55 85 4005-5952 or 5874 E-mail: ri@mdiasbranco.com.br
37
Market Marker Independent Auditors B3 Ticker MDIA3 Custodian
2018 2018
Key charts from 2018 Investor Day
Access complete version: http://ri.mdiasbranco.com.br/wp- content/uploads/sites/15/2018/12/Presentation_MD iasDay2018_ENG.pdf
Brads that occupy various pricing positioning
Nielsen Brasil Price Index
Jan to aug/18
Pasta 166 54 58 132 M.Dias has 13 brands in this range
95%
M Dias has 14 brands in this range 40
4% 1%
Cookies and Crackers Market in Volume (%) Nielsen Brasil Price Index
Jan to aug/18
Market in Volume (%)
91% 6% 3%
Geographical map of areas where we operate
(categories x states x priorities)
High/Medium Relevance Low Relevance Do not operate
GEOGRAPHIC STRATEGY FINNA GEOGRAPHIC STRATEGY VITARELLA GEOGRAPHIC STRATEGY ADRIA
Illustrative images
41
42
Communication and activation plan at our points of sale
Traditional Media External Media Social Media Points of Sale
43
Social Media
44
Merchandising material aligned with brand positioning Activation calendar in all categories
Marketing at POS
Opportunity for Product Line Expansions
360º Platform
360º Platform 45
46
Share Volume
Pluslife
Fonte: Nielsen, Retail 2.0
Total Cookies
Brazil (Retail + Cash)
0.0 0.4 0.8 1.6 2.3 2.5 3.2 3.2 3.5 4.0 3.8 3.7 4.1 4.0 4.1 4.1 4.5
,0 ,0 ,0 ,0 ,0 ,0 ,0 ,0 ,0 ,0 ,0
jun/17 jul/17 aug/17 sep/17
nov/17 dec/17 jan/18 feb/18 mar/18 apr/18 may/18 jun/18 jul/18 aug/18 sep/18
SHARE VOLUME
47
Strategy of action
48
R$6,625 618
R$ 11,183
755 R$6,163 445 R$ 2,287 388 R$ 4,188 541 R$ 2,274 278 R$ 846 R$ 2,844 R$ 2,064 R$ 2,604 R$ 8,488 R$ 4,992
Market in R$ million Market in thousand tons
Cookies and Crackers Pasta
Defense Growth Attack Defense Growth Attack
Source: Nielsen, ABIMAPI and MDB Analysis
60.7 24.1 19.0 63.0 32.1
9.2
Opportunities for growth throughout Brazil
49
R$ 1,066 262 R$ 415 27 R$ 2,129 380 R$ 2,081 356 R$ 3,057 180 R$ 480 R$ 374 R$ 1,260 R$ 1,609 R$ 2,755
Regular Hard grain Semolina
Semolina with eggs
Instant
Source: Nielsen, ABIMAPI and MDB Analysis
55.0 10.0 40.8 22.7
9.9
Market in R$ million Market in thousand tons
... and also growth opportunities in large pasta categories
50
Source: Nielsen, ABIMAPI and MDB Analysis Market in R$ million Market in thousand tons
R$ 3.791 396 R$ 2.430 240 R$ 6.208 453 R$ 2.347 134 R$ 1.503 145 R$ 1.509 R$ 1.203 R$ 3.824 R$ 1.858 R$ 1.432 R$ 192 4 R$ 3.333 253 R$ 2.606 138 R$ 1.231 35
R$ 122 R$ 2.686 R$ 2.262 R$ 1.154
60.2 50.5 38.4 20.8
4.7
36.1 19.4 13.2
6.2
... in cookies and crackers, growth opportunities in volume and high added value categories
51
SUPPLIER PRODUCTION STORAGE DELIVERY CLIENTS ▪400 Provider ▪+2000 Items ▪Free Shipping ▪15 Industrial Units ▪1,403 Products ▪145 Lines ▪38 CD's ▪170 thousand Positions ▪+190 thousand shipments ▪Own fleet ▪OTM1 ▪ASCP2 ▪Scripting ▪+60,000
Customers ▪10 KA3 ▪6 C & A4 ▪2,000 Regional Networks ▪40 Export ▪+100,000 Requests
Nota: 1Oracle Transportation Management
2 Advanced Supply Chain Planning 3 Key Account 4 Cash & Carry and Wholesale
How to plan the best logistics operation in Brazil?
52
Some Recent Highlights
Exclusive caramelized biscuit Popular and healthy
Healthy and Tasty Convenience Healthy and Tasty Convenience
1st M. Dias Healthy Line
Indulgence and Experience Accessible to All Indulgence and Experience Accessible to All
Thermo resistant vegetable cream for the foreign market
Accessible to All 2017 2018 2018 2018 2018
2017: 43 projects 2018: 34 projects
Praticality and Convenience Indulgence and Experience 2018
2017: 36 new products 2018: 23 new products
53
Portfolio Management
Class 5: Everything new (new technology, new position) Class 4: Existing market technology, but new to MDB (entry into a new market, category, etc). Class 3: Product line extension Class 2: Improvement /Saving Class 1: Transfer
Class 5 Class 4 Class 3 Class 2 Class 1
Impact (direct and indirect) Familiarity Risk HIGH MEDIUM LOW
Class 5 Class 4 Class 3 Class 2 Class 1
54
Regulatory Radar: Heat Map Regulatório
Sugar Reduction Integral Trans Fat Front Nutrition Labeling
(since 2016)
Illustrative images
Regulatory Map
HIGH LOW LOW HIGH Impact to M. Dias
55
Nutritional Guide (since 2018)
JOY GOOD BETTER BEST
TOTAL SUGARS SATURATED FAT SODIUM
ATTRIBUTES
PROVIDE PRODUCTS WITH POSITIVE
SOURCE OF FIBERS, WHOLE GRAIN CEREALS, GRAINS, SEEDS, ETC...
BEST FOR YOU BETTER FOR YOU GOOD FOR YOU JOY FOR YOU
Products focused on specific consumption and indulgence moments Products that are consumed daily Products with better nutritional balance Products with more specific nutritional claims.
56
STARTUPS APPLIED TO THE PROGRAM
STARTUPS WERE APPROVED FOR THE PILOT PHASE Ingredients and Packaging New Business Marketing and Trade Marketing
Germinating business, nurturing the future
Results Presentation 2018 and 4Q18
The statements contained in this document related to the management's views on the business of M. Dias Branco are merely trends and, as such, are based exclusively on management's perspective on the continuity of past and present actions, based on facts that have already occurred. These trends do not constitute projections or estimates, and may be substantially altered by changes in market conditions, the performance of the Brazilian economy, the sector and international markets.
59
60
On May 16, 2018, the Company concluded the acquisition of 100% of Indústria de Alimentos Piraquê S.A. (“Piraquê”). Piraquê’s results for the period between May 17 and September 30, 2018, can be found in the consolidated information of this document. This presentation includes some information excluding Piraquê’s results (“without Piraquê”).
61
62
Innovation in Cracker Synergy with Piraquê brand Product for export Innovation in Cookies
in excess of R$ 500 million
Margin Adjusted EBITDA 2017: 14.0% Margin Adjusted EBITDA 2018: 15.3%
63
64
Buy one and get items for free Digital Influencer | Digital marketing Points of sale
65
66
1st inventory of greenhouse gas emissions (GHG) Lower water consumption (m³ / ton produced): -14.3% in 4Q18 vs. 4Q17 and -8.5% 2018 vs. 2017. SDG
Evolution of Organizational Climate ICO * of 71.3 points in 2018
67
* Organizational Climate Index
68
69
Variation of Net Revenue - 2018 vs. 2017 (R$ Million) | M.Dias + Piraquê
5,415 6,025
154 103 75 14 2 292 10 123 7 8
Net revenue 2017 Cookies and Crackers Pasta Wheat Flour and Bran Margarine and Vegetables Shortening Others Products Cookies and Crackers Pasta Wheat Flour and Bran Margarine and Vegetables Shortening Others Products Net revenue 2018
Volume Effect Price Effect +5.3% +9.0%
+1.9% +10.1% +0.9% +13.0% +2.0% +6.0%
70
Variation of Net Revenue - 2018 vs. 2017 (R$ Million) | M. Dias
+2.5%
+1.2% +4.4% 0.0% +13.0% +1.8% +5.7% Volume Effect Price Effect
5,415 5,597
8 28 74 14 2 128 1 107 6 8
1. 000 1. 500 2. 000 2. 500 3. 000 3. 500 4. 000 4. 500 5. 000 5. 500Net revenue 2017 Cookies and Crackers Pasta Wheat Flour and Bran Margarine and Vegetables Shortening Others Products Cookies and Crackers Pasta Wheat Flour and Bran Margarine and Vegetables Shortening Others Products Net revenue 2018
71
Variation of Net Revenue - 4Q18 vs. 4Q17 (R$ Million) | M.Dias + Piraquê
1,364 1,580
12 28 44 2 1 117 31 67 2 1
1. 000 1. 100 1. 200 1. 300 1. 400 1. 500 1. 600 1. 700 1. 800Net revenue 4Q17 Cookies and Crackers Pasta Wheat Flour and Bran Margarine and Vegetables Shortening Others Products Cookies and Crackers Pasta Wheat Flour and Bran Margarine and Vegetables Shortening Others Products Net revenue 4Q18
+1.7% +10.0%
+1.9%
+16.2% +11.0% +32.4% +2.9% +3.4% Volume Effect Price Effect
72
Variation of Net Revenue – 4Q18 vs. 4Q17 (R$ Million) | M.Dias
1,364 1,412
49 44 1 1 51 28 59 2 1
1. 000 1. 100 1. 200 1. 300 1. 400 1. 500 1. 600 1. 700 1. 800Net revenue 4Q17 Cookies and Crackers Pasta Wheat Flour and Bran Margarine and Vegetables Shortening Others Products Cookies and Crackers Pasta Wheat Flour and Bran Margarine and Vegetables Shortening Others Products Net revenue 4Q18
+0.2%
+1.4%
+7.1% +9.7% +32.4% +2.6% +4.2% Volume Effect Price Effect
Product Line 2018 vs. 2017 4Q18 vs. 4Q17
73
s 1Share volume: 34.0% (+1.5 p.p vs. 2017) Share Value: 28.2% (+3.8 p.p vs. 2017) Share volume: 36.0% (+3.6 p.p vs. 2017) Share Value: 31.7% (+3.1 p.p vs. 2017) Share volume: 35.6% (+3.7 p.p vs. 4Q17) Share Valor: 30.5% (+6.5 p.p vs. 4Q17) Share volume: 37.9% (+4.4 p.p vs. 4Q17) Share Valor: 33.4% (-0.1p.p vs 4Q17)
Note: NIELSEN data for the period from January to December 2018, covering Piraquê de mai-dez / 18 The variations presented refer to the periods Jan-Dec/2018 vs. 2017 and Nov-Dec/2018 vs. 2017.
75% 67%
60 % 80 % 10 0% 12 0% 14 0% 16 0% 18 0% 20 0%4Q17 4Q18
74
Production Capacity (Thousand Ton) and Usage Level (%)
2017 2018
75
Verticalization of Wheat Flour and Vegetable Shortening
Wheat Flour Vegetable Shortening
92.1% 85.0% 82.6% 98.7%
2017 2018
24.6% 27.5% 23.1% 24.0% 9.3% 9.1% 7.8% 9.0%
4Q17 4Q18
76
COGS (% Net Revenue) impacted by the increase in the cost
26.0% 25.6%
1.6% 0.1% 0.8% 0.5% 0.2%
Operating Expenses 2017 Other expenses with marketing, sales and logistics. Freights Salaries and benefits Non-recurring expenses Other operating expenses Operacional Expenses 2018
Evolution Operating expenses (% Net Revenue) | M.Dias + Piraquê | 2018 vs. 2017
77
Reduction of operating expenses (M. Dias Branco + Piraquê), even with negative impact of non-recurring items 2018 vs. 2017
¹Note: Non-recurring expenses associated with Piraquê (R$ 6.4 million), Independent Committee (R$ 19.5 million) and expenses incurred by Piraquê, with consultancy and restructuring (R$ 4.9 million). ²Note: Regarding administrative expenses, administration fees, tax expenses and other operating expenses, without non-recurring expenses. 1 2
78
¹Note: Non-recurring expenses associated with Piraquê (R$ 2.0 million), Independent Committee (R$ 11.4
million) and expenses incurred by Piraquê with consultancy and restructuring (R$ 0.1 million). ²Note: Regarding administrative expenses, administration fees, tax expenses and other operating expenses, without non-recurring expenses.
Evolution Operating expenses (% Net Revenue) | M.Dias + Piraquê | 4Q18 vs. 4Q17
Reduction of operating expenses (M. Dias Branco + Piraquê), even with negative impact of non-recurring items 4Q18 vs. 4Q17 27.5% 26.6%
2.1% 1.0% 0.9% 0.7%
Operating Expenses 4Q17 Other expenses with marketing, sales and logistics. Salaries and benefits Non-recurring expenses Other operating expenses Operacional Expenses 4Q18
1 2
193.3 183.5 275.8 283.8 189.9
14.2% 15.1% 18.6% 16.3% 12.0%
0, 0% 5, 0% 10 , 0 % 15 , 0 % 20 , 0 % 25 , 0 % 30 , 0 % 35 , 0 % 40 , 0 % 45 , 0 % 50 , 0 %4Q17 1Q18 2Q18 3Q18 4Q18
50 10 15 20 25 30 35 40 45 50EBITDA EBITDA Margin
4Q18 vs. 4Q17
2018 vs. 2017
Reduction of expenses, contributing to the positive result
EBITDA (R$ Million) and EBITDA Margin (% Net Revenue)
79
17.8% 15.5%
0, 10 0, 20 0, 30 0, 40 0, 50 0, 60 0, 70, 80 0, 90 0, 10 00, 0% 10 % 20 % 30 % 40 % 50 % 60 % 70 % 80 %2017 2018
EBITDA EBITDA Margin
2018 vs. 2017
4Q18 vs. 4Q17
80
15.6% 12.0%
2017 2018
10 20 30 40 50 60 70 80 90 0% 10 % 20 % 30 % 40 % 50 % 60 %Net Profit Net Margin
201.9 139.7 209.7 234.3 139.8
14.8% 11.5% 14.1% 13.4% 8.9%
4Q17 1Q18 2Q18 3Q18 4Q18
50 10 15 20 25 30 35 40 45 50 0% 10 % 20 % 30 % 40 % 50 % 60 % 70 % 80 %Net Profit Net Margin
81
Ongoing construction of the new milling unit in Bento Gonçalves (RS); Reuse of effluents in the Fats and Margarines unit in Fortaleza (CE); Implantation of the flour line at the Eusébio plant (CE);
2018 vs. 2017
329.5 301.1 6,1% 5,0%
2017 2018
50 10 15 20 25 30 35 0% 5% 10 % 15 % 20 % 25 % 30 % 35 % 40 % 45 % 50 %Capex (Million) Capex/Net Revenue
925.9 451.0
779.9 300.0 401.8 132.4 23.8 1,306.4 7.7 113.7
Cash and Cash Equivalents in Dec-17 Net Cash from
activities Payment of property and software licenses Financing activities Dividends (interest on
Payment for the acquisition
Acquisition of Equity Interest Investment applications Cash and cash equivalents acquired Cash and Cash Equivalents in Dec-18
12.9% of Net Revenue in 2018
82
83
2017 2018
84
Average Daily Volume: MDIA3 (R$ million)
Profitability%
0% 10% 20% 30% 40% 5 10 15 20 25 30 35 40
jan-18 feb-18 mar-18 apr-18 may-18 jun-18 jul-18 aug-18 sep-18
nov-18 dec-18 jan-19 feb-19 mar-19
Volume (Millions) MDIA3 IBOV IGC
www.mdiasbranco.com.br/ri ri@mdiasbranco.com.br
New Business and Investor Relations Director Phone.: (85) 4005-5730 E-mail: fabio.cefaly@mdiasbranco.com.br
Vice-President of Investments and Controllership Phone.: (85) 4005-5874 E-mail: geraldo@mdiasbranco.com.br