PRESENTATION ON MINING FACILITY DEFICIENCIES Peter Airey 1 ABSTRACT: - - PDF document

presentation on mining facility deficiencies
SMART_READER_LITE
LIVE PREVIEW

PRESENTATION ON MINING FACILITY DEFICIENCIES Peter Airey 1 ABSTRACT: - - PDF document

PRESENTATION ON MINING FACILITY DEFICIENCIES Peter Airey 1 ABSTRACT: A major investigation of deficiencies in the structures of two $1.3B mines. The number of load combinations for the most complex structures exceeded 50. Of particular interest was


slide-1
SLIDE 1

PRESENTATION ON MINING FACILITY DEFICIENCIES

Peter Airey 1

ABSTRACT: A major investigation of deficiencies in the structures of two $1.3B mines. The number of load combinations for the most complex structures exceeded 50. Of particular interest was the investigation of vibration induced on the structures by the equipment supported. The performance of the structures was modelled using a Finite Element 3D Model generated in SAP2000 Software based on provided documentation. Dynamic loads for vibrating machinery were applied as a time history function for Harmonic linear analysis of the Finite Element Model. Following modelling the vibration within sample elements of the structures was measured on site. The actual velocity measured was compared to that predicted. We concluded that, for equipment of the type required to be accommodated on the WS&S building adoption of a steel framed structure is appropriate. It is concluded that for Crusher facilities adoption of a structure of high mass (not steel framed is appropriate to achieve tolerable levels of vibration attenuation. KEY WORDS: Mining Structures, Crushers, Vibration amplitude, Resonant frequency, Transmissibility

1 INTRODUCTION

In 2014 I was briefed to investigate the deficiencies in the structures of two $1.3 billion mines. Structures for mining facilities endure many more load cases than occur with buildings. The number of load combinations for the most complex structures exceeded

  • 50. Of particular interest, and the subject of this

presentation, is the investigation of vibration induced on the structures by the equipment supported.

2 TYPES OF STRUCTURES

The structures investigated on both mines included the Crusher support structure and the Wet Scrubbing and Screening support structures. In the case of the Crusher Building the vibration component to the structure is primarily from the Primary Crusher and from the Secondary Crusher. This underestimates the complexity of the installation which includes a Run of Mill Bin, a Rock Breaker, Primary Sizer Crusher, a Secondary Sizer Crusher, an Apron Feeder, an Apron Feeder Feed Chute, a Dribble Chute, Primary Sizer Feed Chute, Primary Sizer Travelling Chute, Secondary Sizer Discharge Chute and a Secondary Sizer Maintenance Overhead Crane. All of these items are accommodated by the structure and the structure responds to their activity by vibrating.

1 Peter Airey, Managing Director, Airey Taylor Pty Ltd; Chairman, AdvancedSubstructures. Email: mail@atconsulting.com.au

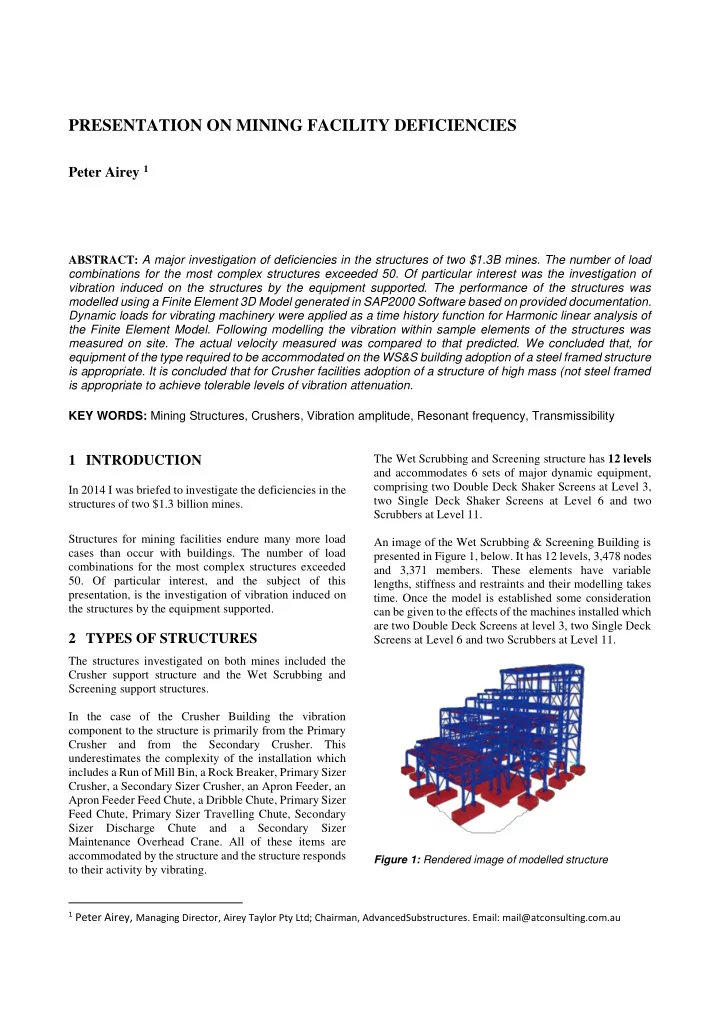
The Wet Scrubbing and Screening structure has 12 levels and accommodates 6 sets of major dynamic equipment, comprising two Double Deck Shaker Screens at Level 3, two Single Deck Shaker Screens at Level 6 and two Scrubbers at Level 11. An image of the Wet Scrubbing & Screening Building is presented in Figure 1, below. It has 12 levels, 3,478 nodes and 3,371 members. These elements have variable lengths, stiffness and restraints and their modelling takes

  • time. Once the model is established some consideration

can be given to the effects of the machines installed which are two Double Deck Screens at level 3, two Single Deck Screens at Level 6 and two Scrubbers at Level 11.

Figure 1: Rendered image of modelled structure

slide-2
SLIDE 2

3 RANGE OF CONDITIONS

As a start point the analysis requires knowledge of the machine operating frequencies and they were, for the Single Deck Screen, 900 plus or minus 10% revs per minute (13.5 Hertz is considered). For the Double Deck Screen, 802 plus or minus 10% revs per minute, 12 Hertz is considered and for the Scrubbing and Screening the drive 1,500 revs per minute (25 Hertz is considered) for the Pinion, 281 revs per minute, 4.68 Hertz is considered and for the Mill, 15.15 revs per minute. During pre- commissioning, commissioning, operation, start-up, shut- down and other probable operational conditions, different vibration scenarios are feasible. To perform an accurate assessment of the structural response, it is essential to predict the probable working

  • scenarios. This required close co-operation with the

process and operational team. This was available from our Client. Derived from our discussions with them we defined a series of working scenarios which could be examined

  • mathematically. They were:

In the first instance, when 50% of the plant is in operation while maintaining other equipment on product line. This meant that one set of product line machines, Scrubber, Single Deck Screen and Double Deck Screen was in

  • peration while the other set may have been removed

from the structure. The second scenario was for the six machines to start together in phase or with some time lag being out of phase with different scenarios feasible in this regard. The third of the scenarios was the pre-commissioning scenario when machines may be energised with or without

  • ther vibrating machines and static equipment in place.

Finally three individual models were generated. They were an operational model with the machine lower

  • perating frequency with operational mass source of 0.9

dead load plus zero live load plus 0.3 x material load. The second case looked at was the commissioning load with full machine frequency range to upper operating frequency with commissioning mass source 0.9 dead load plus 0.3 x the live load plus zero material load. The last was a seismic load with machine lower operating frequency with seismic mass source, one dead load plus 0.3 live load plus 0.6 material load.

4 TOLERABLE RANGE

An important parameter for consideration of all cases is the damping ratio and guidance provided to the original Design Engineers by the owner was that they should use a damping ratio of 2%. The owners of the mine elected to commission operation measurement specialists to measure the actual vibration occurring. The measured damping ratio was higher than that suggested and found be 3.3%. The criteria given to the Design Engineers to manage vibration was that the vibration velocity should not exceed 5mm per second. Modelling suggested that this would be exceeded. The diagram presented in Figure 2, below, plots the frequency on the horizontal axis and the amplitude of vibration measured in millimetres on the vertical axis. This is a very important graph because it gives guidance as to how the whole structure is responding to the excitation and is a decision making form of presentation. In essence, the lower the performance is by way of amplitude given the particular frequency, the safer the

  • peration is. Above the upper band of darkness is an area

where the system is in dire trouble. In the D Area, which is the upper band, failure is near. It needs to be corrected almost immediately to avoid breakdown. Below this there is a white band and if the amplitude is within the white band correction in the near term (say within 10 days) is

  • appropriate. For the lower areas the dark lower band and

the white area, the situation is tolerable and operationally acceptable.

Figure 2: Amplitude vs. Frequency Graph for the modelled structure

Not surprisingly the Design Criteria provided to the Designers requires that the ratio of the forcing frequency to the resonant frequency of the structure must be less than 0.5 or greater than 1.5. Resonance is a phenomena of uncontrolled increase in vibrational amplitude exhibited by a physical system when it is subjected to an external vibration when the forcing frequency approaches the natural free oscillational frequency of the structure. At resonant frequency small periodic driving forces have the

slide-3
SLIDE 3

ability to produce large amplitude oscillations. This is because the system stores vibrational energy. Figure 3, which is the graph of frequency ratio plotted against transmissibility, illustrates the point. At 0.5, which is say a couple of standard deviations off one, that’s pretty safe. At 1.5 likewise. But in the middle there is a no-go zone.

Figure 3: Graph of Frequency Ratio vs. Transmissibility

The Design Criteria given to the Engineers of Record was that the structure must not be low tuned. This means that the natural frequency of the structure must be less than the

  • perational speed of the main machines. Low tuned

structures should be generally avoided as this can occur momentarily during start-up and for longer periods during shut-down or if the equipment is operating below its nominal peak speed. The classical example of this is vibrating pile driving equipment during start up and shut down.

5 ASSESSING MODEL PREDICTIONS

It is not often that one gets to check whether modelling is really accurate. I present to you an example of what the site measurement and model prediction achieved for the particular building. As can be seen in Table 1, the minimum vertical velocity and the maximum vertical velocity were very close indeed to the prediction, and for the horizontal direction the correlation was similar.

Table 1: Site Measurement compared to Model Prediction

It was concluded by us that the problems with the structure which had a general velocity of elements three times that required was that the design philosophy and geometry made this a certainty. In our opinion, if a rigid concrete structure had been adopted up to Level 3, which is the level at which the Double Deck Screens were supported, or up to Level 9 with the surrounding steel structure isolated to form the access platforms, almost none of the vibration in either operating or start-up modes would exceed the desired upper limit. Before you is presented a 3-dimensional depiction of the Crusher and Screening structure, and as you can see, it is fully steel framed. It shares the first step of mineral processing where the ore from the mine site is fed through mechanical equipment in order to reduce the size for subsequent stages. The Crushers reduce the size of the run

  • f the mill ore to a size that can be fed to downstream

equipment for further processing. Depending upon the requirement, there can be a primary, secondary, tertiary and quaternary set of crushers. The Primary Crusher received feed from bins into which raw ore is fed. The crusher weighs 165 tonnes. The feed is allegedly limited to rock not exceeding 3 tonnes in size. Control of this is difficult and some feed is larger, resulting in phenomena known as “marbling.” This phenomena comprising a flicking of 3 to 5 tonne lumps of

  • re into the air by the prongs of the crusher, initiating huge
  • vibration. A cursory investigation revealed that for the

crusher building, the owner objective of restricting vibration to less that 5mm per second and velocity was not

  • met. Acceleration is just about off the planet, with

measured vibration acceleration (via Vipac) of the Primary Crusher when operational of up to 12 G’s. Needless to say, some elements of the structure are being damaged by the high level

  • f

vibration. I stress that our investigation of the crusher was subordinate to our brief to investigate the Wet Scrubbing and Screening support structures, but the scale of the vibration generated by the marbling phenomena was noteworthy.

slide-4
SLIDE 4

6 CONCLUSIONS

For mining structures that may provide a range of functions, it is essential to ensure that structures will be suitable for a full range of alternative functions including startup and high frequency vibrations. Once again, we concluded that the form of structure used to accommodate the Primary Crusher would be better, in fact much better off, if a structure of greater mass (as could be achieved by the use of a concrete rather than steel structure) was used to support the Primary and Secondary Crusher, with the subordinate structure associated with it

  • f steel work rather than the primary construction of steel.

ACKNOWLEDGEMENT

I acknowledge the assistance of my staff, Ms Shaya Azizi MSc BSc MIEAust and Mr Ali Sabouhi MSc BSc, who worked diligently on the project.

REFERENCES:

[1] SAP2000 Integrated Software for structural analysis (2018). Computers and Structures Inc. 1646N California Blvd, Walnut Creek, CA94596 USA. [2] Basics of Structural Vibration and Testing Analysis (2003) Dactron Inc, 1629 South Main St, Milpitar, CA 95035 USA. [3] Rio Tinto Sustainable development report (2016) 152 St George’s Tce, Perth WA 6001.